
In this Areopa Academy webinar — the 90th in the series — Duilio Tacconi presents a practical guide to using Azure Data Explorer (ADE) as the primary tool for analyzing Business Central telemetry. The session covers everything from creating an Application Insights resource from scratch to running live troubleshooting queries on a production environment, using a custom KQL-based dashboard that Duilio shared publicly at Directions North America 2024.
Telemetry Goals: Observability and Troubleshooting
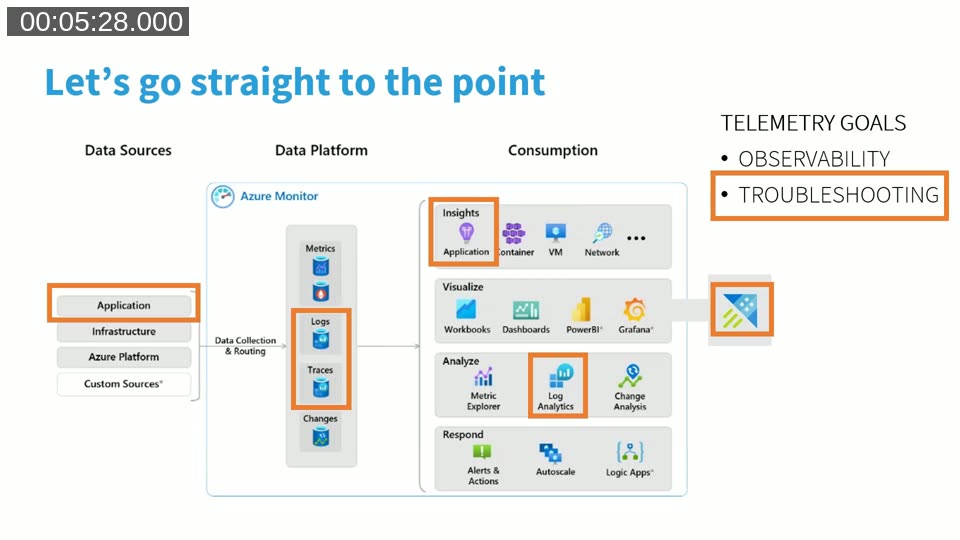
Business Central telemetry serves two distinct purposes. Observability means taking a longer-term view — monitoring how an environment or app performs over a 30, 60, or 90-day window and identifying trends. Troubleshooting is near-real-time: signals typically arrive within 15 seconds to 1 minute after an event, making it possible to diagnose issues as they happen.
Business Central emits telemetry signals to Azure Monitor, where they are stored in a Log Analytics workspace as two main tables: traces and pageViews. On top of that workspace, Application Insights provides querying, alerting, dashboards, and data retention management.
📖 Docs: Monitoring and Analyzing Telemetry — Microsoft Learn — Overview of all available telemetry signals in Business Central and how to enable them.
Choosing the Right Tool
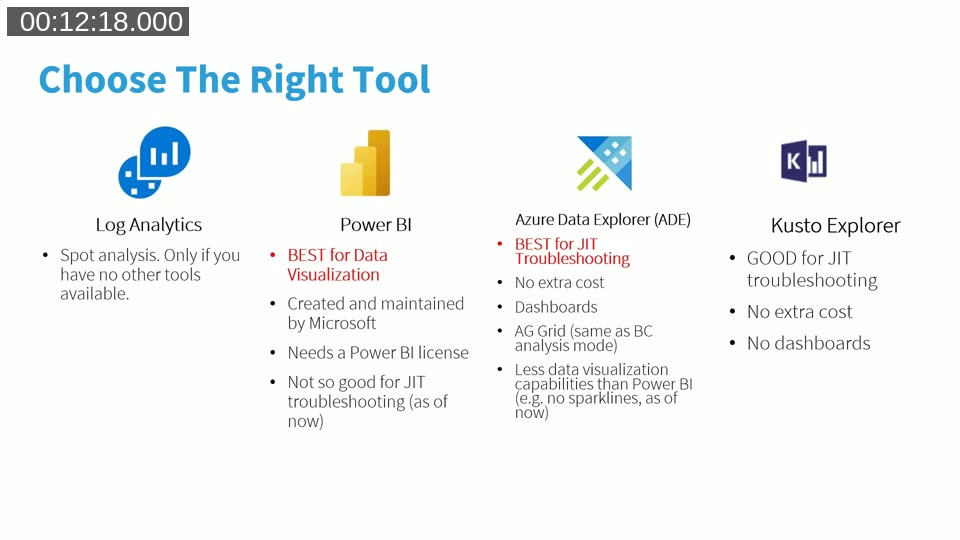
Duilio compares the four main options for working with BC telemetry data:
- Log Analytics (Logs in Application Insights) — useful for spot analysis when no other tools are available. Not ideal for sharing or building dashboards.
- Power BI (Dynamics 365 Business Central Usage app) — best for data visualization and static observability. Requires a Power BI Pro license and is not suited for just-in-time troubleshooting due to refresh latency.
- Kusto Explorer — a free desktop application, good for running ad-hoc KQL queries. No dashboard capability.
- Azure Data Explorer (ADE) — Duilio’s recommendation. Free to use (you only pay for Log Analytics ingestion), supports dashboards with multiple pages, and updates in real time. The grid-based layout is similar to the BC analysis mode, so BC practitioners already have the mental model.
ADE dashboards are JSON files — they can be exported, shared, version-controlled, and imported into any ADE instance. Each tile on a dashboard is backed by a KQL query, and the entire dashboard refreshes dynamically when time-range or filter parameters change.
Setting Up from Scratch
Step 1 — Create an Application Insights Resource
In the Azure portal, create an Application Insights resource and associate it with a Log Analytics workspace. Note the connection string from the Overview page — this is what BC uses to send telemetry.
📖 Docs: Turn Environment Telemetry On or Off — Microsoft Learn — Step-by-step instructions for enabling telemetry on BC online and on-premises environments, including the admin center procedure.
Step 2 — Connect Business Central to Application Insights
In the Business Central Admin Center, open the environment, choose Define → Enable Application Insights, paste the connection string, and save. Saving triggers an environment restart, so plan this during a maintenance window.
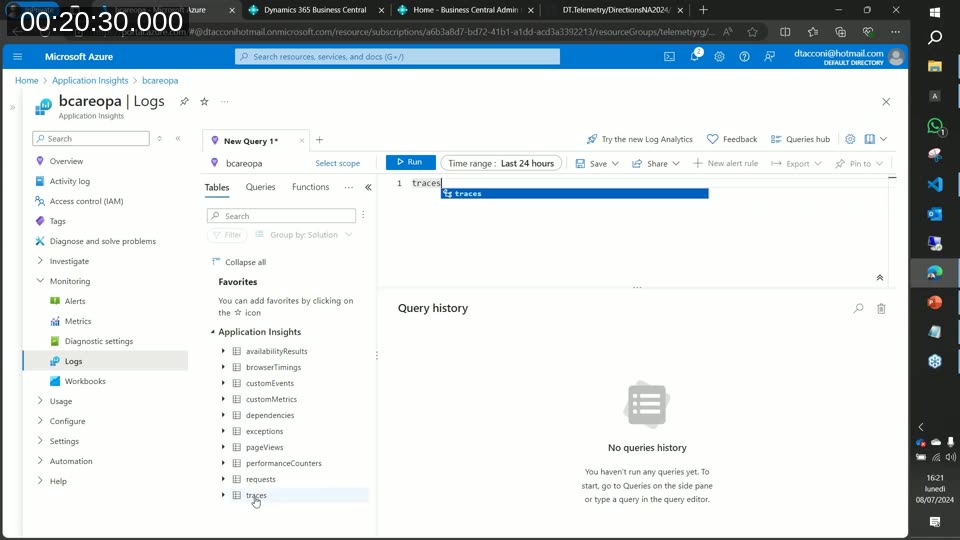
Once connected, data flows into the traces and pageViews tables within minutes. You can verify this in the Application Insights Logs editor by running a simple KQL query:
traces
| where timestamp > ago(1h)
| summarize count() by message
Step 3 — Connect ADE to Your Application Insights Resource
Navigate to dataexplorer.azure.com and add a connection using the ADE Application Insights endpoint:
https://ade.applicationinsights.io/subscriptions/{subscriptionId}
Once connected, ADE presents all Application Insights instances under that subscription as databases. You can run the same KQL queries you would run in the Log Analytics editor, but you can also pin results directly to a dashboard and save named query tabs.
Exploring ADE Dashboard Capabilities
Before moving to the BC-specific dashboard, Duilio walks through the built-in sample dashboards to illustrate what ADE can do. The sample demo dashboard demonstrates dynamic parameters, query-based markdown tiles, pie charts, maps, and anomaly detection.
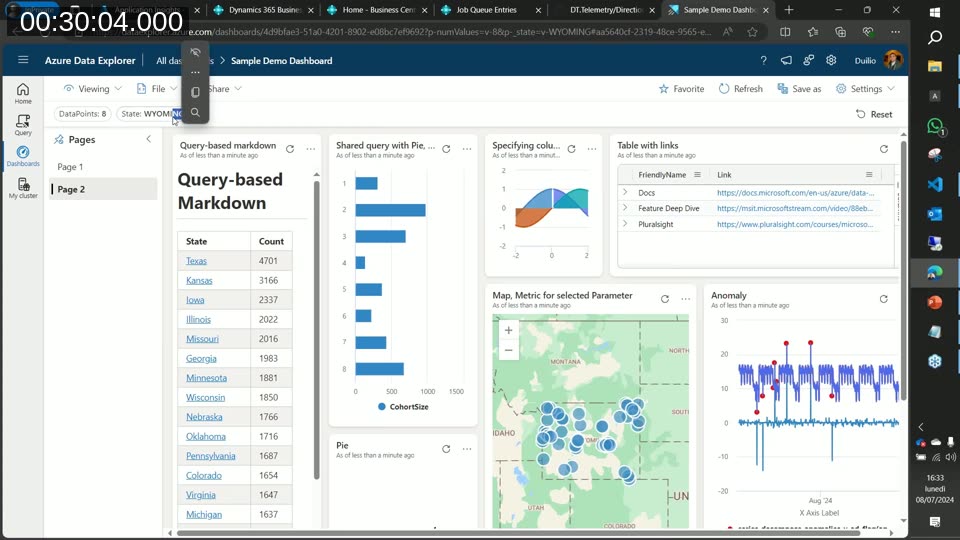
Key capabilities highlighted:
- Each tile has a View Query action — you can inspect, fork, and modify the underlying KQL query directly from the dashboard.
- Pin to Dashboard — after running a query in the query editor, you can pin the result as a new tile to any existing dashboard.
- Dashboards support multiple pages, tile resizing, conditional formatting, and markdown tiles for documentation or links.
- Dashboard JSON files can be imported and exported — making it straightforward to share dashboards across teams or between customer environments.
📖 Docs: Visualize Data with Azure Data Explorer Dashboards — Microsoft Learn — How to create, configure, and share ADE dashboards, including parameters and tile types.
Importing the Business Central Insights Dashboard
Duilio’s custom dashboard — shared publicly as a JSON file — is imported via Dashboards → Import dashboard from file. After import, you connect it to a data source by editing the data source settings and pointing it to your Application Insights–connected ADE cluster and database. Once saved, all tiles populate with live data.
The dashboard is structured around a set of pages, each covering a different troubleshooting area: Overview, Statistics, SQL Query Usage, AL Usage, Deadlocks/Locks, Page Performance, OData Usage, Incoming and Outgoing Web Services, Job Queue, Miscellaneous, Environment, Data Ingestion, Details, Post Update, and “What Was Running”.
Resources for getting started with ADE dashboards for BC telemetry:
- microsoft/BCTech — AzureDataExplorer samples — Microsoft’s official sample dashboard JSON files and KQL queries.
- Handling Business Central Telemetry Like a Boss — waldo.be — Waldo’s ADE dashboard, published shortly before this webinar.
- duiliotacconi.com — Duilio’s blog, where his dashboard is also available.
Troubleshooting a Live Production Environment
The second half of the session uses a real production environment (approximately 150 active users per day, running fully on SaaS) to demonstrate how each dashboard page is used in practice.
Environment Page — Platform Updates and Upgrade History
The Environment page shows platform update history and environment upgrade lifecycle data. By using a max() aggregation over telemetry signals binned by time, the dashboard can reconstruct which component version was running at any given point — even though BC does not emit a dedicated “component version changed” signal.
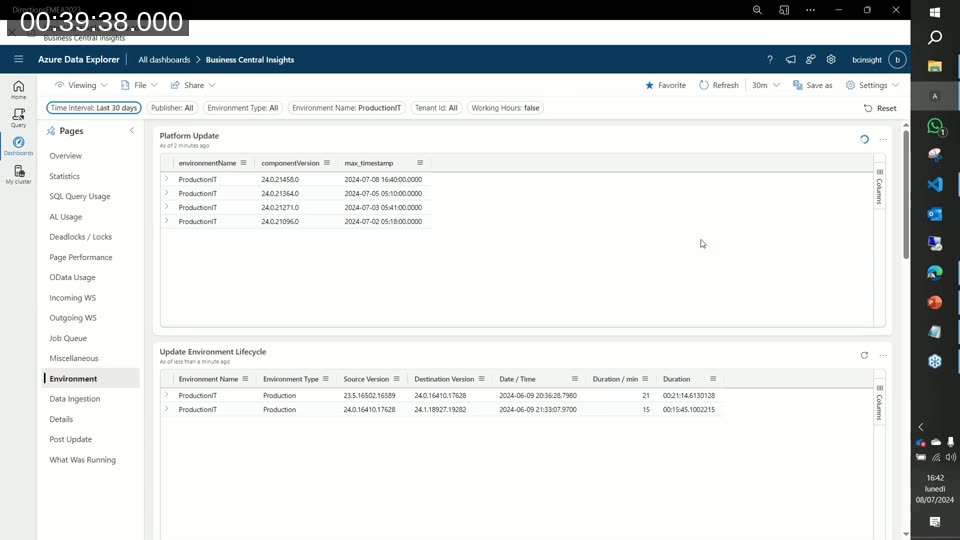
The upgrade timeline in the demo shows the environment moving from version 23.5 to 24.0 on the night of 9 June 2024, with the two-step upgrade taking roughly 21 and 15 minutes respectively. The Data Ingestion tile, driven by an external JSON lookup file hosted in Azure Blob Storage, maps raw signal names to human-readable descriptions.
Statistics Page — Long-Term Trend Analysis
The Statistics page provides a helicopter view of environment health, aggregated weekly. The charts shown in the demo include:
- Number of long-running SQL queries per week
- Number of long-running AL methods per week
- Number of SQL deadlocks per week
- Number of SQL lock timeouts per week
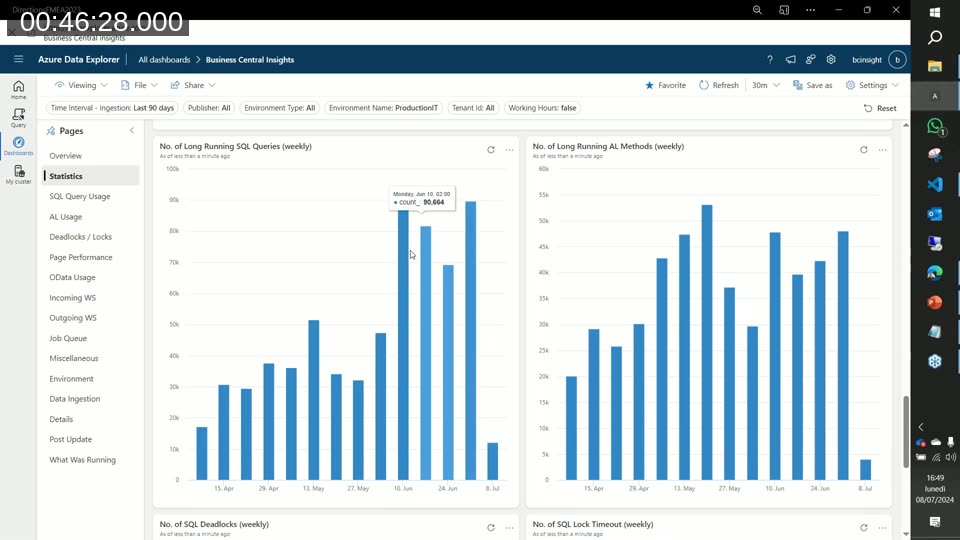
In the demo environment, the weekly charts clearly show a shift in behavior from version 23.5 to version 24.0: the number of long-running queries increased slightly, but this correlated with the introduction of a read-only replica. Queries routed to the read replica — where a 750 ms threshold still triggers a telemetry signal — accounted for the apparent increase, while user-reported performance actually improved after the upgrade.
📖 Docs: Analyzing Long Running Operation (SQL Query) Telemetry — Microsoft Learn — Details on the 750 ms default threshold, what fields are available in the signal, and how to use the AL stack trace to identify the source.
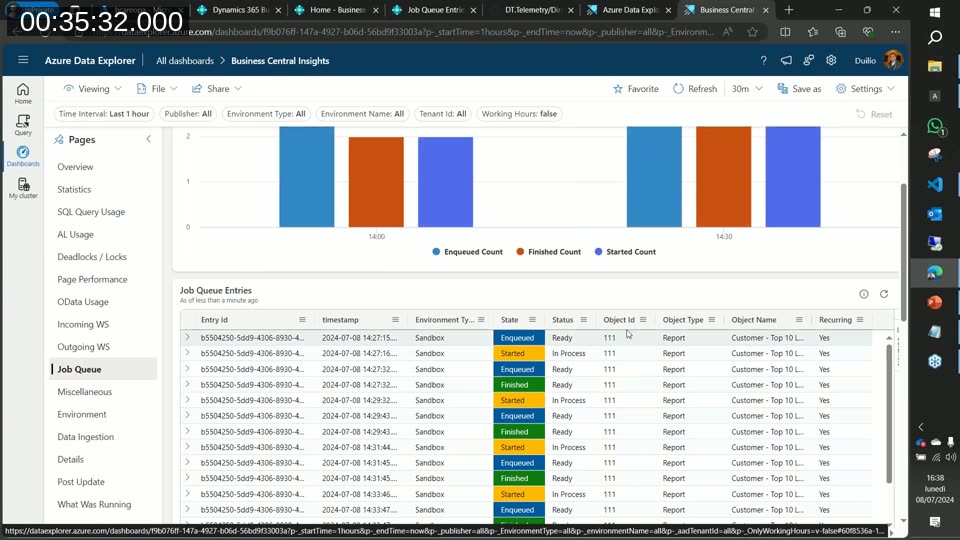
SQL Query Usage — Just-in-Time Troubleshooting
The SQL Query Usage page is designed for real-time analysis. Filtering to the last 3 hours, the LRQ Summarized by Object table lists every AL object generating long-running SQL queries, with columns for object ID, type, name, client type, isolation level, SQL statement, count, average duration, and percentage share of total long-running queries.
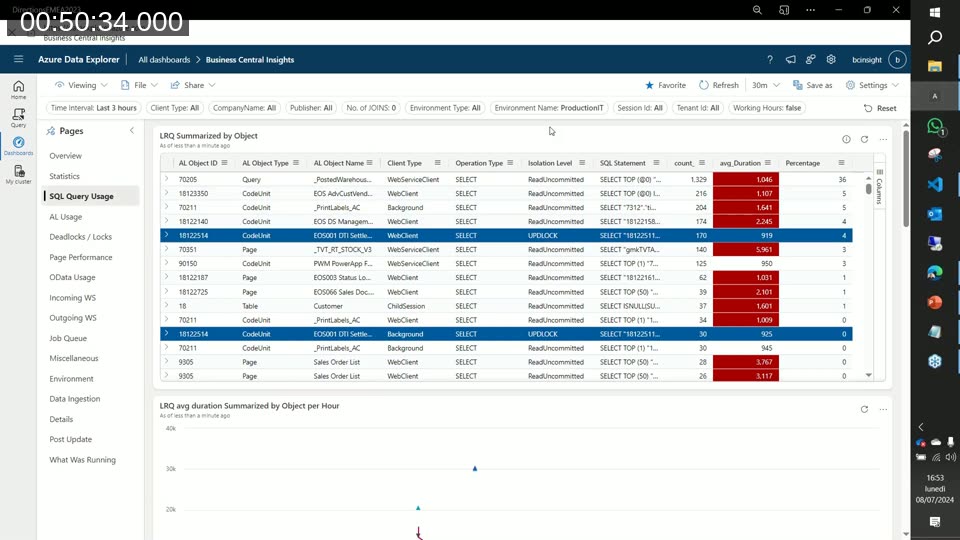
Rows with an UPDLOCK isolation level are highlighted, as they indicate write operations that can contribute to locking. In the demo environment, UPDLOCK entries represented 4% of long-running queries, each averaging around 1 second — within acceptable limits.
An accompanying SQL Execution Chart tile visualises the volume of long-running queries over time, split into locking and non-locking categories, making it easy to spot spikes of locking activity at a glance.
Page Performance
The Page Performance page groups page view durations across the chosen time window, showing execution count, mean time, and max time per page. Filtering for pages with at least 300 executions and sorting by average duration surfaces the pages worth investigating.
In the demo, most pages ran between 0.5 and 3 seconds. A small number of pages — including Posted Sales Invoices and Sales Orders — showed averages above 3 seconds, identifying specific areas for further optimisation work.
Post Update Analysis — Comparing Two Periods
The Post Update page is one of the most distinctive features of the dashboard. It accepts two custom time ranges — the period before an update and the period after — joins the telemetry for both periods, and computes delta counts and delta percentages for page views, long-running AL methods, and API calls.
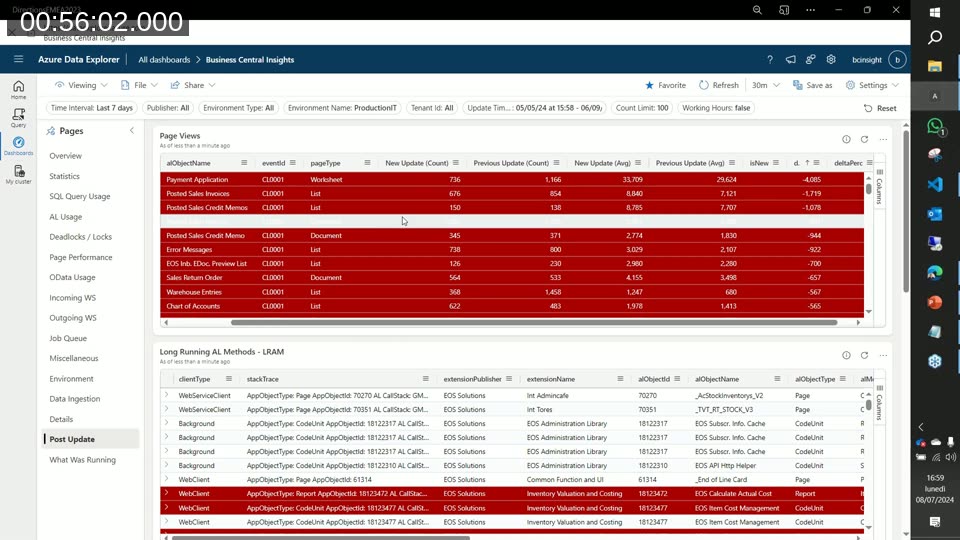
In the demo, comparing the 23.5 and 24.0 periods showed Payment Application running 40% slower after the upgrade (from 29 seconds average to 33 seconds). This kind of structured comparison turns an upgrade review from an anecdotal process into a data-driven one — and the same technique applies to long-running queries and API response times.
Q&A Highlights
Can you distinguish read-only replica queries from primary node queries?
Not directly — BC telemetry does not currently expose which node (primary or read-only replica) processed a given query. Duilio workarounds this limitation using the Report Intent pattern: reports set with DataAccessIntent = ReadOnly are likely routed to the replica. He tracks this in the Miscellaneous page of his dashboard, which shows report intent alongside execution count and average duration — helping identify which reports are safe candidates for read-only routing.
Where should someone start if they have never used ADE?
Duilio recommends downloading an existing dashboard — either his own, Waldo’s, or the one in the aka.ms/bctelemetry samples repository — and exploring from there. The built-in ADE sample dashboards are also a good way to understand how parameters, markdown tiles, and different chart types work before building custom tiles.
This post was drafted with AI assistance based on the webinar transcript and video content.