Most AL developers know the familiar performance tools: the page inspector, the debugger, the Business Central Performance Toolkit (BCPT), the AL and InClient profilers, and the event log. In this webinar, waldo (moderated by Luc van Vugt) looks past that list and demonstrates the tooling he built and uses himself: waldo.BCPerfTool, an open-source app for running and comparing AL performance tests, and how it connects to flame graphs and Grafana Pyroscope to visualize what a Business Central call stack is actually doing. The session also walks through how that integration is built, so viewers can build similar tooling of their own.
A Map of Business Central Performance Tooling
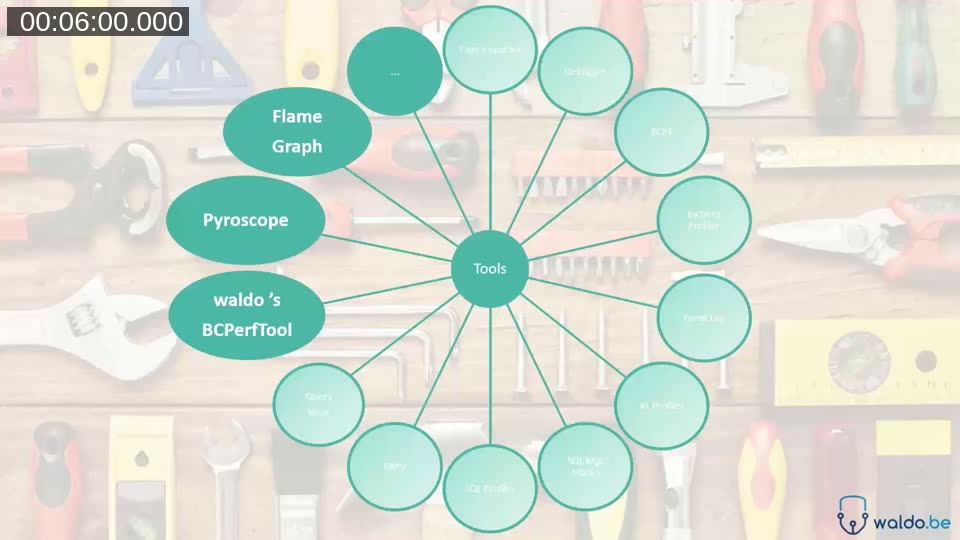
waldo opens by grouping performance tools into three tiers. The familiar tier covers what most developers already reach for: the page inspector, the debugger, BCPT, the AL profiler and InClient profiler (waldo’s own favorites for drilling into a specific problem), and the event log for long-running session information. A somewhat less familiar tier sits on the SQL Server side — SQL Server Management Studio, Dynamic Management Views, and Query Store — but these are on-premises only and are not covered in this session. The talk focuses on a third, less familiar tier: waldo.BCPerfTool, Flame Graph, and Pyroscope.
waldo.BCPerfTool: A Purpose-Built Performance Testing App
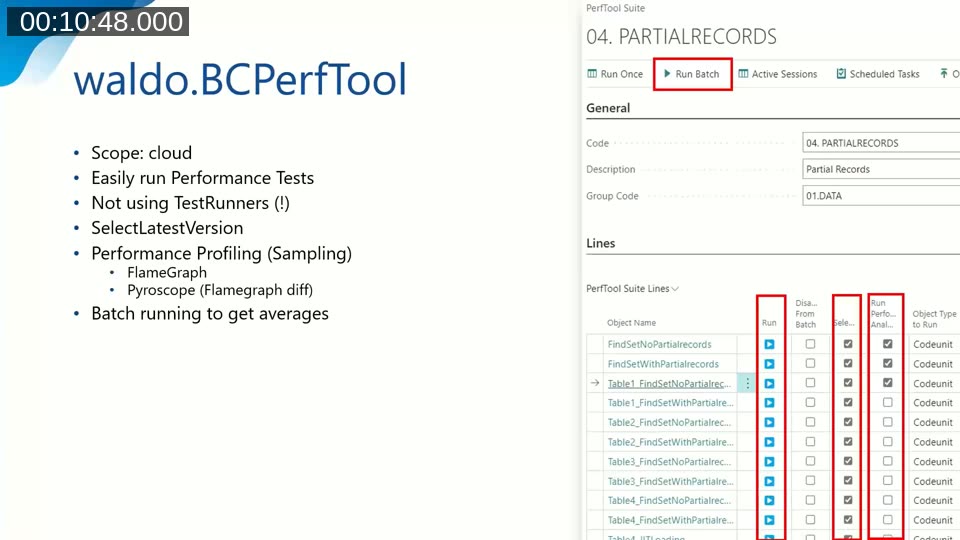
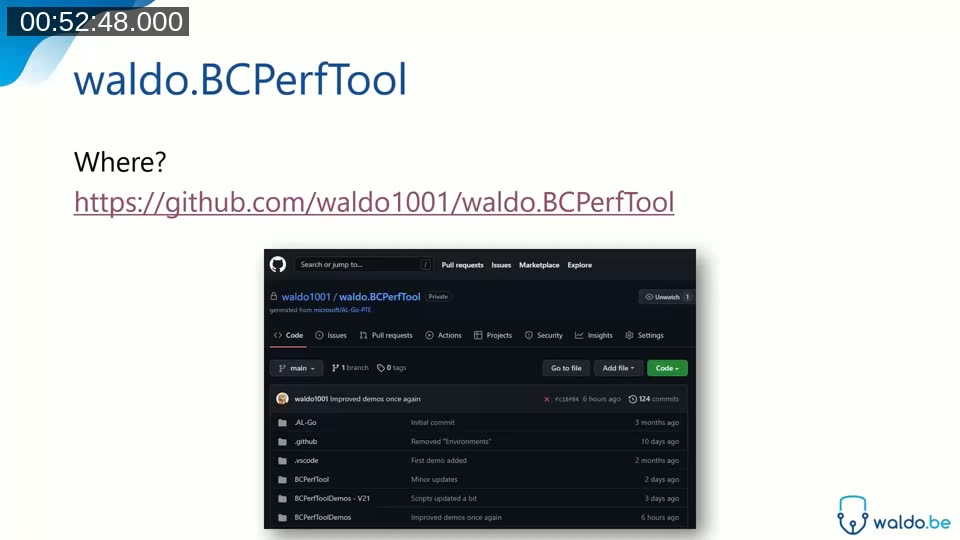
waldo.BCPerfTool is an app he built for himself, with no dependencies on BCPT. Its scope is cloud, meaning it runs both in a Business Central online sandbox and in a PTE. The goal is to make it fast and easy to set up any performance scenario and get statistics back — suites and suite lines group related test cases, each pointing at a codeunit, page, report, table, or query to run.
A few design choices stand out:
- No test runners. waldo deliberately avoided BCPT’s testability framework, because he wanted to measure the actual performance impact of code as it runs, not performance measured through an extra layer that rolls back or wraps a transaction.
- SelectLatestVersion. An option to force reading the latest record state rather than relying on cached data, so repeated runs reflect real conditions.
- Batch running. Running a suite as a batch executes it multiple times in sequence to smooth out a slower first run and produce a more reliable average.
- Built-in graphs. Averages, actuals, and flame graphs are generated automatically for any suite, letting you run and analyze practically any object without writing custom reporting.
📖 Docs: waldo.BCPerfTool on GitHub — the full source, generated from the microsoft/AL-Go-PTE template and released under the MIT license.
Demo: Comparing CalcFields In and Out of a Loop
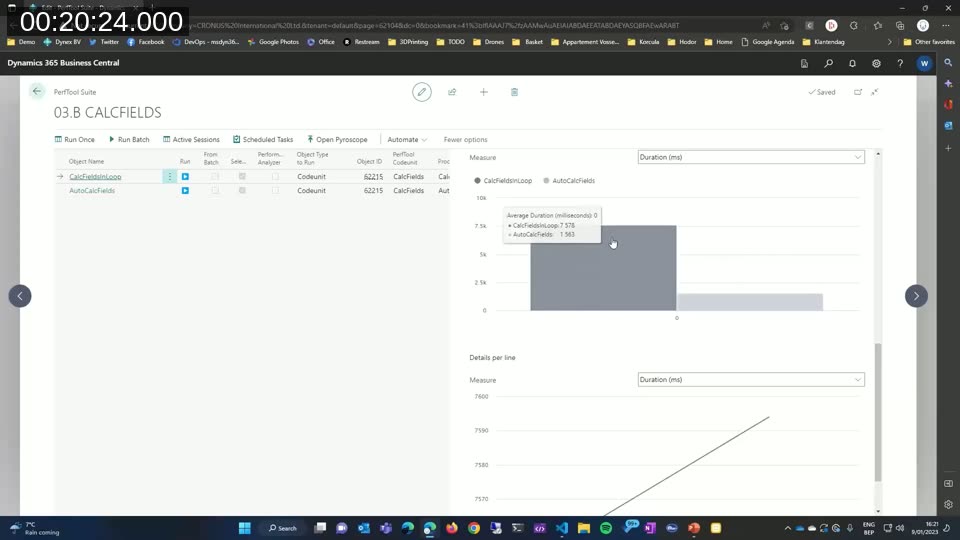
To show the tool in action, waldo runs a classic comparison: calling CalcFields repeatedly inside a loop versus using AutoCalcFields outside of it, across roughly 25,000 iterations. Each run in the PerfTool Suite records the number of records read, the number of SQL statements executed, and the duration, and every run is logged so later runs can be compared against earlier ones. The CalcFieldsInLoop scenario takes several seconds per run; the AutoCalcFields version finishes in about a second — the difference familiar to most AL developers, but now backed by comparable numbers and a duration graph rather than a stopwatch.
Flame Graphs: Visualizing the Call Stack
Beyond simple duration numbers, waldo.BCPerfTool can trigger a flame graph for a suite line. A flame graph renders a captured call stack as a stack of horizontal bars: each bar is a function, its width represents time spent, and stacking shows which function called which. During the demo, running a suite configured for FlameGraph analysis posts a sales invoice and returns an SVG showing exactly where time went across the posting codeunits — from Sales-Post.OnRun down through Gen. Jnl.-Post Line and the G/L and item posting routines.
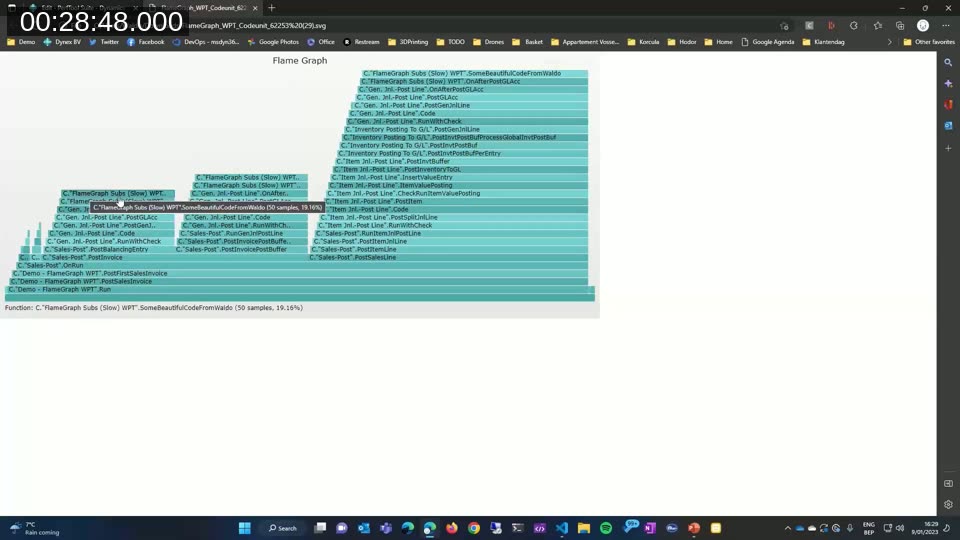
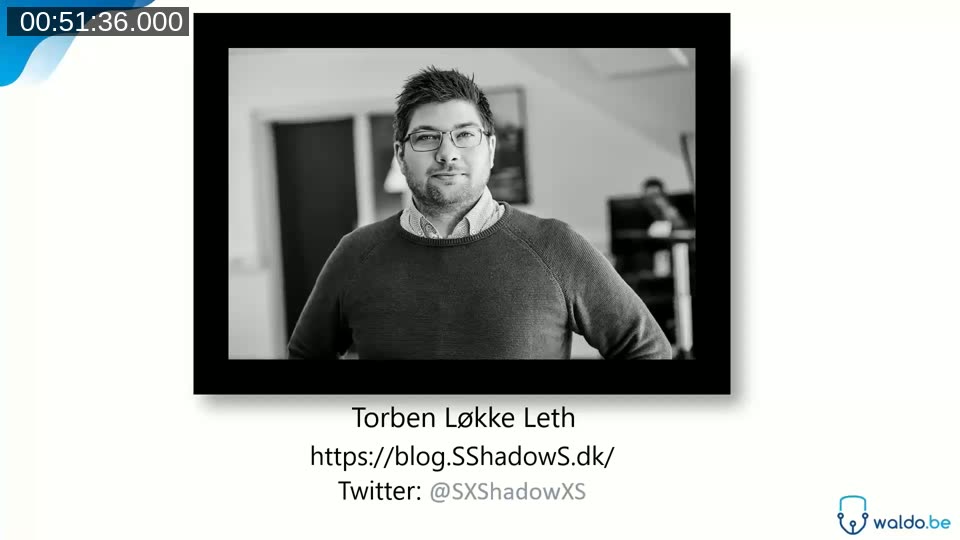
The flame graph rendering itself is not something waldo built: it is powered by a free, open-source conversion service built by community member Torben Loekke Leth, which turns a Business Central CPU profile into an SVG using Brendan Gregg’s original flame graph tooling.
📖 Docs: AL-Flamegraph on GitHub and Flame graphs of BC call stacks — Torben’s write-up of the free hosted service and how it converts .alcpuprofile files into SVG or folded-stack output.
Pyroscope: Comparing Profiles Over Time
The second integration is with Grafana Pyroscope, a continuous profiling tool that stores profiles so they can be browsed and compared later, similar to how an event log stores entries. waldo.BCPerfTool can upload a converted profile straight to a self-hosted Pyroscope instance, tagged with a name and timestamp so it’s easy to find again. The real value shows up in Pyroscope’s diff view: two profiled runs of the same scenario, taken at different points, are overlaid so the added and removed time per function is highlighted directly in the flame graph — useful for confirming a code change actually improved (or regressed) a specific call path rather than just the overall duration.
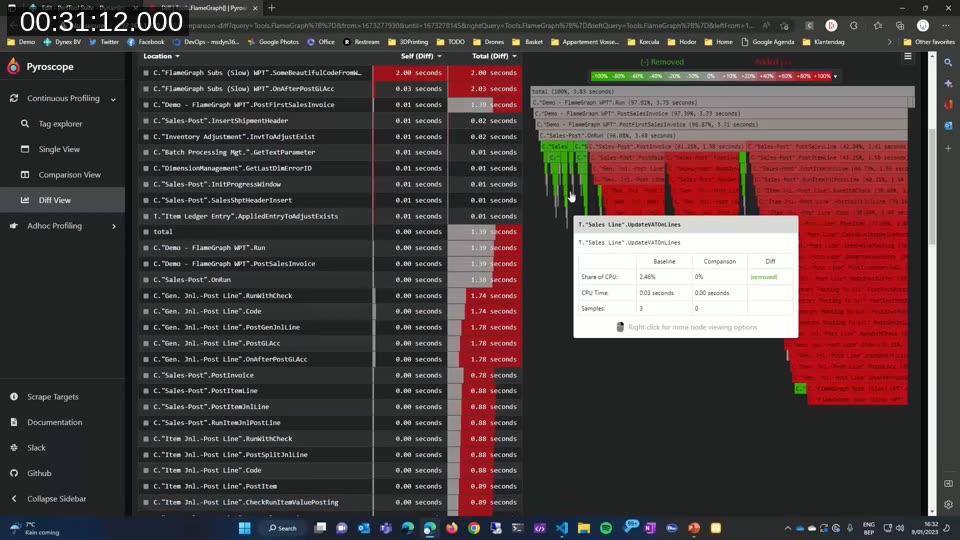
📖 Docs: Flame graphs in Grafana Pyroscope documentation — explains how Pyroscope samples stack traces and renders them, including the diff view used in the demo.
How It Works Under the Hood
In the second half of the session, waldo walks through the plumbing behind these integrations. Every suite line run starts and stops Business Central’s built-in sampling performance profiler through AL — the same profiling API that backs the AL Profiler in VS Code, exposed as start, stop, and get-data procedures on a system codeunit. The captured profile comes back as a JSON CPU profile file, which VS Code already knows how to render if opened directly in the performance profiling editor.
To turn that JSON into a flame graph, waldo.BCPerfTool posts the raw .alcpuprofile content to Torben’s hosted service (blogapi.sshadows.dk/upload) using an HTTP POST, with headers controlling color scheme and whether Business Central’s own internal frames are filtered out. The response comes back as a Base64-encoded SVG. For Pyroscope, the same profile is converted to the folded-stack text format instead of SVG, then uploaded via a second POST that includes a name and a from/until time window, which is what lets Pyroscope place the profile correctly on its timeline for later comparison.
📖 Docs: AL Profiler overview and Performance Profiler overview — Microsoft’s documentation for the sampling and instrumentation profiling capabilities that waldo.BCPerfTool automates.
Credits and Where to Find the Tools
waldo is explicit that the flame graph rendering isn’t his work: it comes from Torben Loekke Leth’s open-source service, itself built on Brendan Gregg’s original flame graph visualization. waldo encourages viewers to follow Torben’s blog for more detail on how the service works.
waldo.BCPerfTool itself is open source and free to use, and had just received a significant update on the day of the recording. waldo mentions telemetry is already wired into the tool, sending the same statistics shown in the app to Business Central’s telemetry, with wait-stats visualization planned as a next step.
This post was drafted with AI assistance based on the webinar transcript and video content.