
In this webinar, Steven Renders (moderated by Luc van Vugt) explains why Power BI dataflows are worth the extra setup step when reporting on Business Central data. He walks through preparing custom APIs in AL, building a dataflow from those APIs, consuming that dataflow from both Power BI and Excel, and the licensing and refresh considerations that come with it.
Preparing the queries: custom APIs over web services
Steven starts from the data source. Business Central exposes a large set of out-of-the-box APIs covering most master data (customers, items, vendors, G/L accounts) and transactional data (sales and purchase documents, ledger entries). For reporting purposes, he generally prefers these APIs over the older SOAP/OData web services, because API pages return the data as-is (a customer list returns customers, not customer ledger entries) and Microsoft states APIs perform roughly 30% faster than web services.
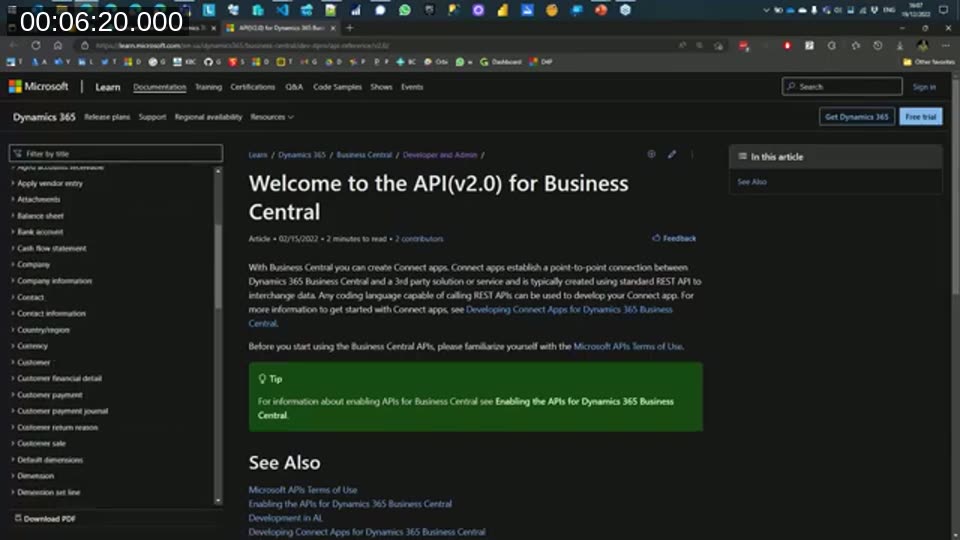
📖 Docs: API (v2.0) for Dynamics 365 Business Central — the reference for the standard API endpoints shown in the demo.
When a field isn’t available on a standard API — his example is a custom “shoe size” field on the customer card — a new API needs to be developed. He builds these as AL query objects rather than API pages, because a query object can group data and return subtotals directly from the database, reducing the size of the result set before it ever reaches Power BI.
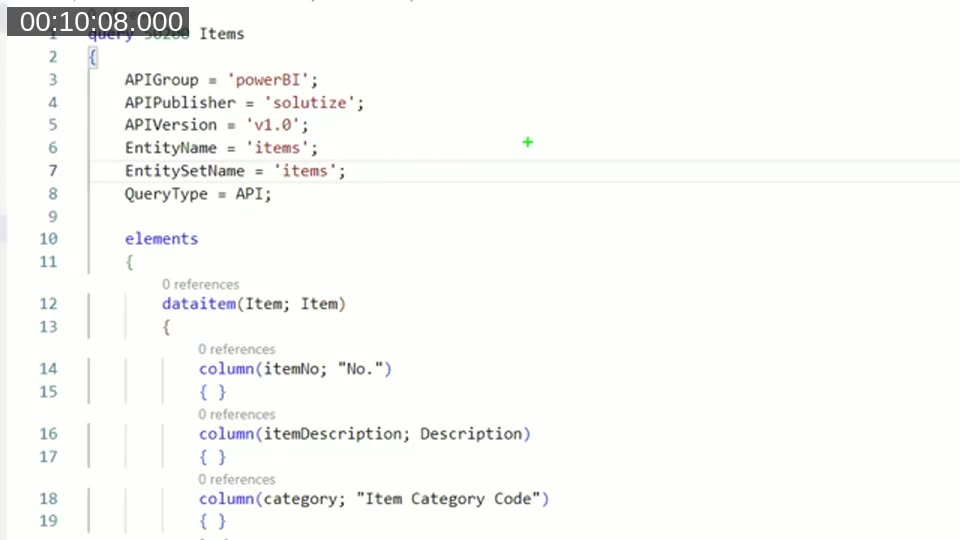
One property he calls out specifically: set DataAccessIntent = ReadOnly on any API used for reporting. This routes the query to the read-only replica of the production database in Business Central SaaS, which keeps report refreshes from competing with normal transactional load.
Structuring APIs around a star or snowflake schema
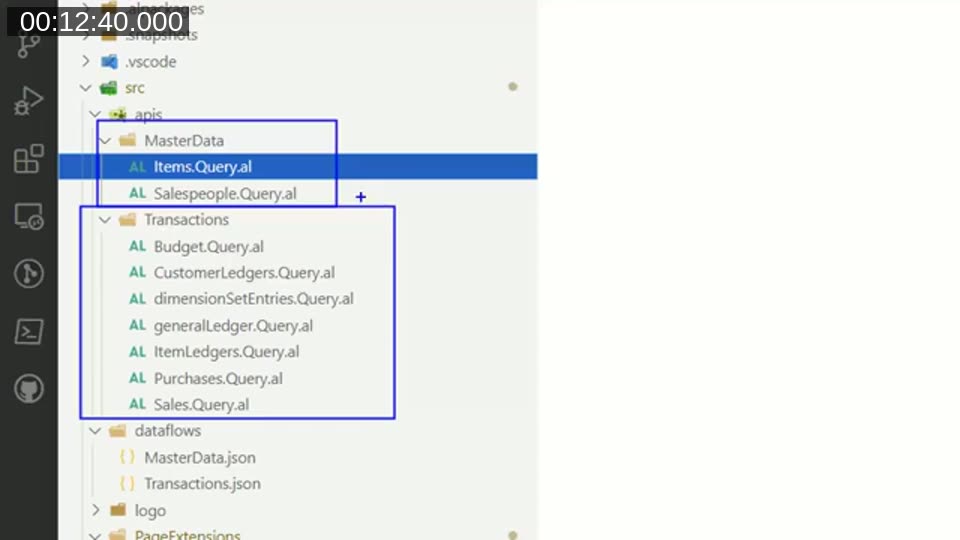
Steven organizes his custom APIs the way he’d organize a Power BI data model: one API per table in a star or snowflake schema, rather than one large API for everything. He treats each API as a reusable building block — a fact table for measurable amounts and quantities, surrounded by dimension tables like customer, item, or calendar. In his own project this results in a MasterData folder (customers, items, salespeople) and a Transactions folder (sales, purchases, general ledger, item ledger) of query objects.

Creating a dataset with dataflows
The core problem dataflows solve: if you build several Power BI reports against Business Central directly, each report re-imports the same customer, item, and ledger data on its own refresh schedule. A dataflow imports that data from Business Central once, into what Steven describes as “a mini data warehouse”, and every report then consumes the dataflow instead of the source system.
A dataflow is, in his words, “Power Query online” — the same transform experience as Power Query in Power BI Desktop or Excel, running as a hosted service. Behind the scenes Power BI stores the data in an Azure Data Lake that you never have to manage directly. Creating one requires a Power BI Pro license and a workspace (dataflows aren’t available in “My Workspace”).
Connecting to Business Central and building a multi-company query
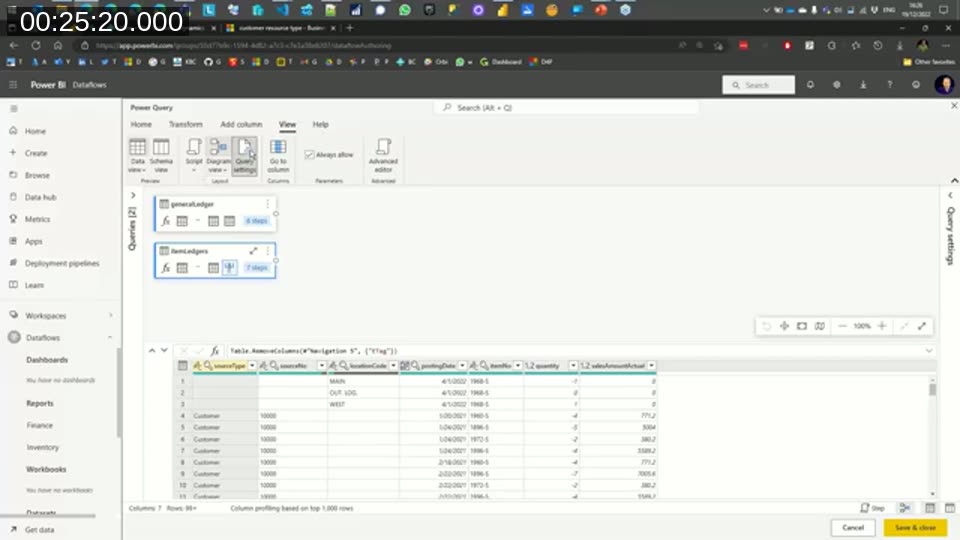
Selecting Business Central as the data source prompts for environment and company — Steven skips these fields on the first pass so he can browse all connected environments and companies instead of typing them by hand. Once inside a company, both standard and custom APIs are listed as data sources, and the Power Query editor behaves exactly as it does in Power BI Desktop: remove columns, filter rows, change data types, or add calculated columns.
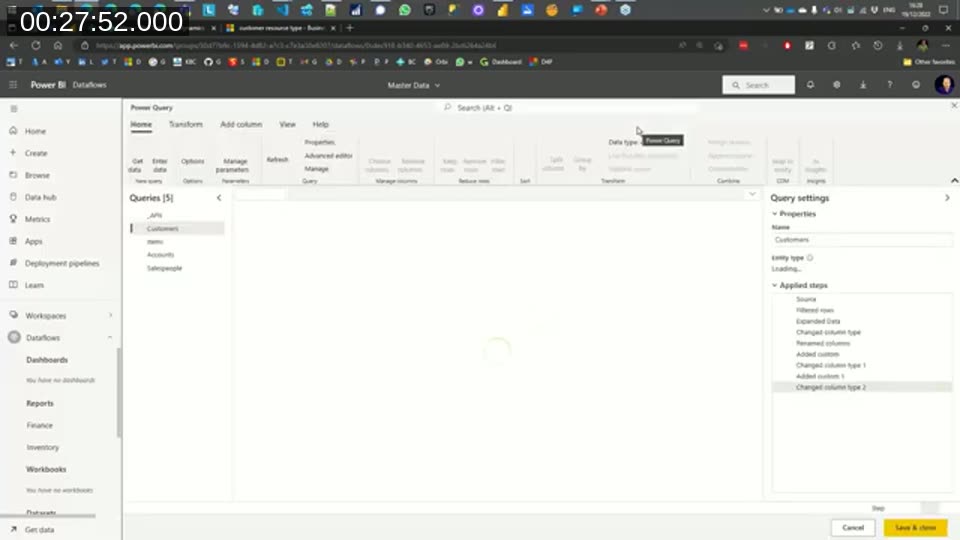
To combine data from multiple companies and environments into one dataflow, he references a base _APIs query rather than duplicating the connection per table, and adds computed keys (environment + company + record number) so rows from different companies stay unique when combined. He points out that this multi-company pattern can disable query folding on later steps — Power Query has to do the work locally instead of pushing it back to Business Central — visible via the folding indicator next to each applied step.
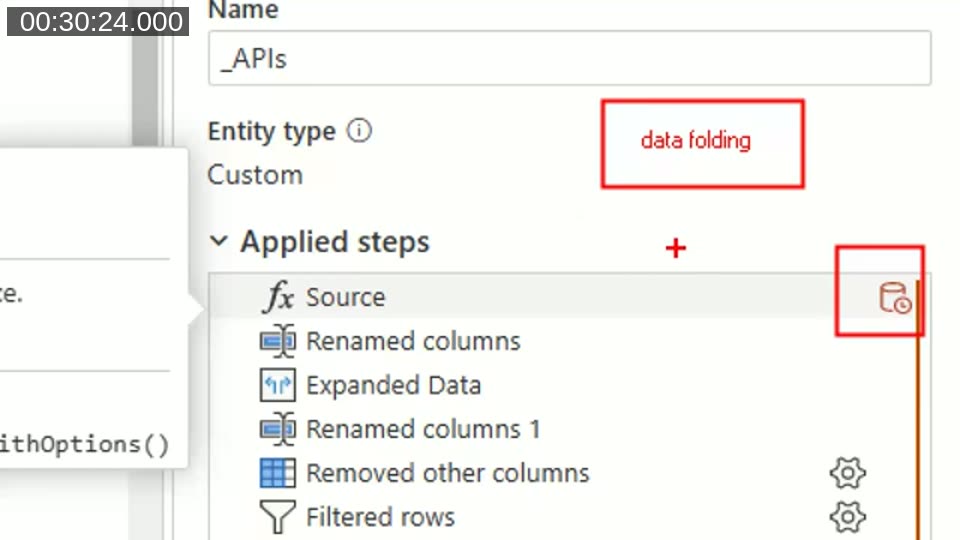
📖 Docs: Understanding query evaluation and query folding in Power Query — explains when Power Query can push a transformation back to the data source versus computing it locally.
Refresh schedules and sharing
Steven splits his dataflows in two — one for master data, one for transactions — mainly so each can carry its own refresh schedule. A Power BI Pro license allows up to 8 scheduled refreshes per day per dataflow; Premium raises that to 48. There’s currently no per-dataflow share button: access is granted by sharing the Power BI workspace that contains the dataflow, with viewer, contributor, or member roles controlling what recipients can do.
📖 Docs: Introduction to dataflows and self-service data prep and Creating a dataflow — the two Microsoft Learn resources Steven points to for a deeper walkthrough of the same steps.
Consuming a dataflow in Power BI
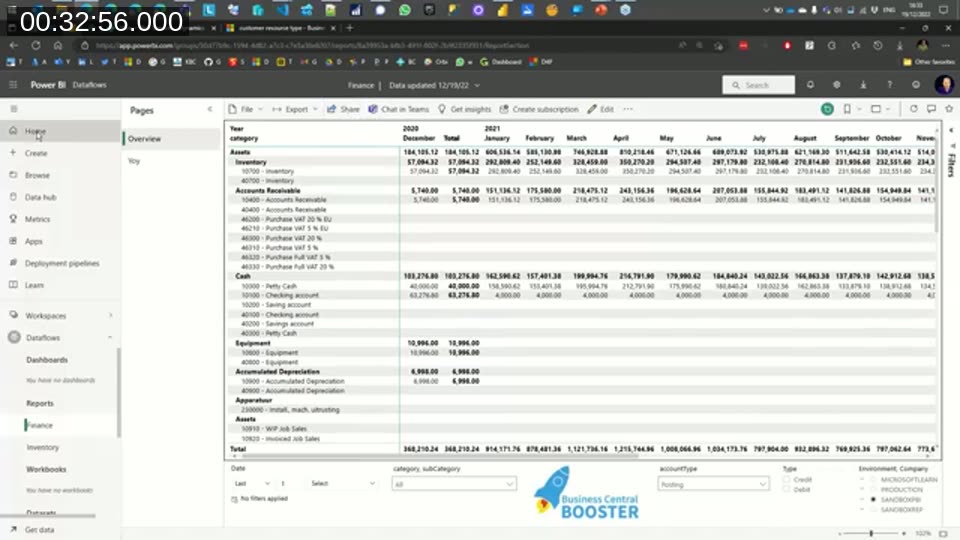
With the dataflow in place, Power BI Desktop’s Get Data dialog gets a new Dataflows option alongside the direct Business Central connector. Reports built this way look identical to reports built straight from Business Central, but every refresh now pulls from the dataflow rather than re-querying Business Central. Because the report’s refresh schedule and the dataflow’s refresh schedule are independent, Steven notes there’s little point setting a report to refresh 48 times a day if the underlying dataflow only refreshes once.
Consuming a dataflow in Excel and Excel report layouts
The same dataflow can be reached from Excel’s Data → Get Data → Power Platform → Dataflows menu, using the same Power Query engine, without opening Power BI Desktop at all. Steven connects this to Business Central’s newer Excel report layouts: an Excel layout generated by a BC report only contains the fields defined in that report’s dataset, but once the file is open, a user can pull in additional columns directly from a dataflow (for example extra general ledger detail not present in the base report) using the same Get Data flow.
He flags one operational detail from the Q&A: an Excel layout deployed as part of an AL extension does not automatically deploy or version the dataflow it depends on. There’s no built-in tooling for this — teams typically script it with PowerShell against the Power BI REST API, similar to how AL extensions are deployed via DevOps pipelines, and should deploy the dataflow before the extension to avoid a broken reference on first refresh.
📖 Docs: Creating an Excel layout report — covers the Data worksheet and metadata fields an Excel report layout depends on.
Why dataflows?
Steven closes with a summary of the advantages he sees in practice:
- Data is read once from Business Central; every report or Excel file after that reads from the dataflow.
- Consumers only need access to the Power BI workspace, not to Business Central itself — useful for analysts without a BC license.
- A dataflow can source and combine data from multiple systems, not just Business Central (Dynamics 365, files on OneDrive, on-premises data via a Power BI Gateway, or another dataflow).
- Security can be managed at the dataflow level, including row-level security in Power BI — though he warns that if the dataflow connects to Business Central using a super-user account, all dataflow consumers get that account’s visibility into the data, regardless of their own Business Central permission sets.
- A dataflow definition can be exported as JSON and imported into another environment, which also makes it something you can version-control alongside an AL project.

Q&A highlights
A few points from the live Q&A worth calling out:
- Pagination: Power Query paginates API calls to Business Central automatically, fetching data in batches — this is why a refresh can take noticeably longer with larger data volumes.
- Cross-tenant data: a single dataflow can’t combine Business Central environments that live in different domains/tenants, and a delegated admin account cannot be used to read APIs or web services for this purpose — the connection needs a user from the target tenant.
This post was drafted with AI assistance based on the webinar transcript and video content.