
In this session, Microsoft MVPs Steven Renders and Renato Fajdiga take a deep dive into combining Power BI with Business Central, moderated by Luc van Vugt. Recorded for Areopa’s 30th webinar, the session covers how to fetch data from Business Central efficiently, how to build a good data model, how to work around the limitations of incremental refresh, how to link actuals and budgets in a single fact table, and how Power BI and Power Apps can be combined in both directions with Business Central.
Getting Data from Business Central into Power BI
Renato Fajdiga opens with an overview of how Business Central data reaches Power BI. Regardless of whether Business Central runs online (SaaS) or on-premises, Power BI can connect through the Business Central connector. On-premises installations also allow a direct SQL Server connection, while the connector itself uses OData to retrieve data from both SaaS and on-premises environments.
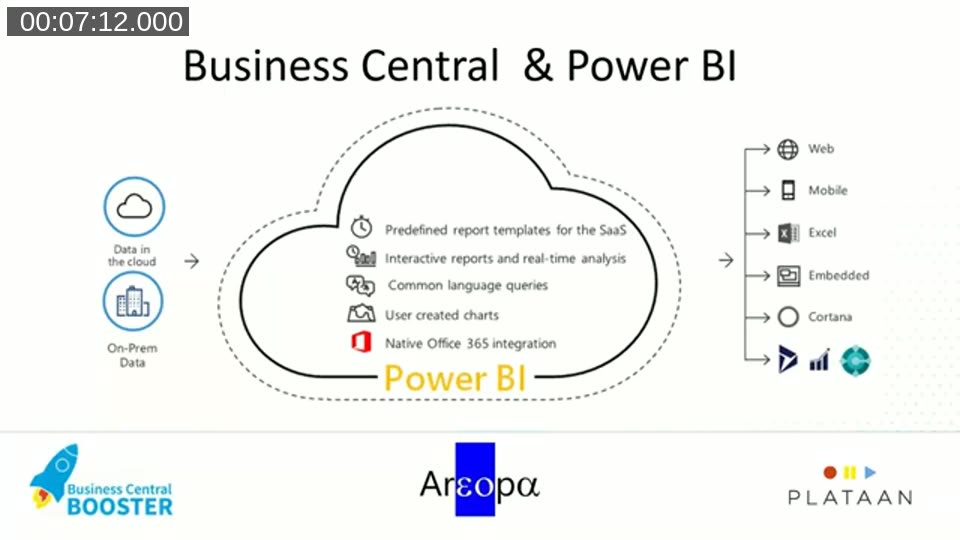
Once a report is built in Power BI Desktop, it can be published to the Power BI service, packaged into an application, and shared with specific users or departments — for example, a procurement team that only needs the inventory-by-location report. Microsoft also publishes ready-made Power BI apps for Business Central SaaS that only require a URL and authentication to populate.
Demo: Building a Query Extension for Inventory Reporting
Renato demonstrates creating an AL query extension that fetches item ledger entry data, joined with the item and location tables, to build an inventory-by-location report. A key detail in the query definition is the DataAccessIntent property set to ReadOnly, which targets the read-only replica of the Business Central database in the cloud. This can reduce load on the primary database at the cost of slightly delayed data.
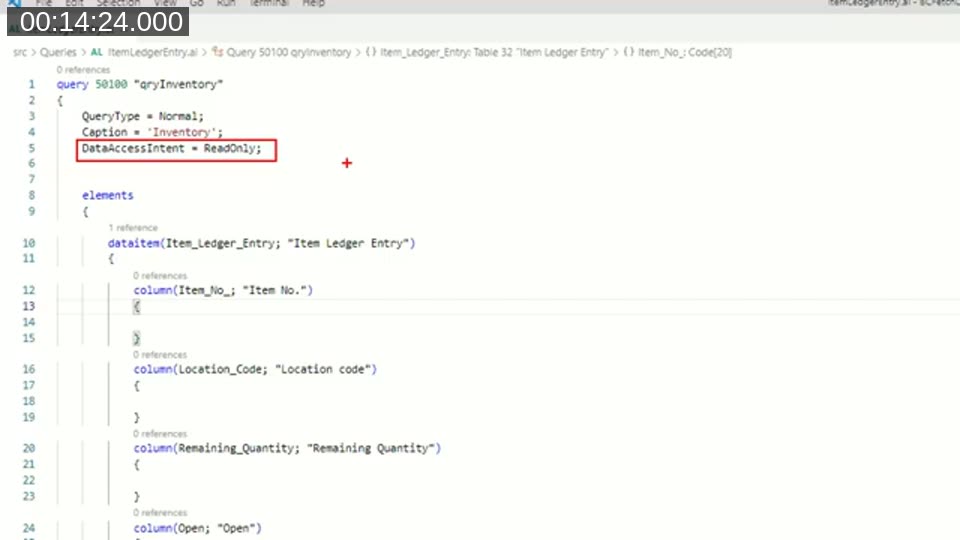
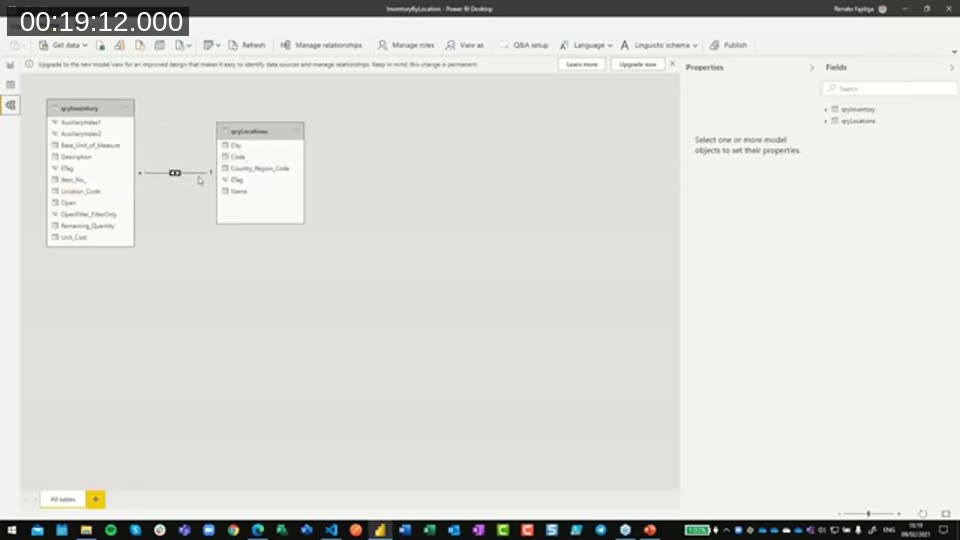
The query is published as a web service and then consumed in Power BI Desktop through the Business Central connector, where the two queries (inventory and locations) are related on location code before building the report visuals.
📖 Docs: Compare REST APIs, OData, and SOAP web services in Business Central — queries can only be published as OData or REST API web services (read-only), never SOAP. Microsoft now recommends REST API web services over OData for new integrations, including for Power BI, though OData remains supported.
Building a Good Data Model: Star and Snowflake Schemas
Steven Renders takes over to explain data modeling. Whether data comes from query or page web services, the recommendation for Power BI Desktop is the same: build a star schema (or snowflake schema for more complex relationships), with one central fact table containing the numbers to analyze — sales, inventory, financial entries — surrounded by dimension tables such as customer, item, or resource.

Steven’s practical recommendation is to keep each fact and dimension table as a separate query object in Business Central, so they act as reusable building blocks across multiple reports. He prefers queries over pages because queries support aggregation methods (totals and group-by), which reduce the size of the result set — pages are a better fit only when a calculated field is needed, since query objects cannot perform calculations. A data model that doesn’t follow a star or snowflake pattern still works, but tends to show performance problems and forces increasingly complex DAX formulas — a sign to revisit the model rather than the formula.
📖 Docs: Understand star schema and the importance for Power BI — Microsoft’s own guidance on why dimension and fact tables produce better-performing, easier-to-maintain semantic models.
Working Around Incremental Refresh Limitations
By default, every Power BI refresh — manual or scheduled — reloads the full dataset. Power BI’s built-in incremental refresh feature is available from the Pro tier upward, but it depends on query folding, which works well against a SQL database but does not work against OData sources. Since Business Central’s connector is OData-based, the built-in feature isn’t usable directly.
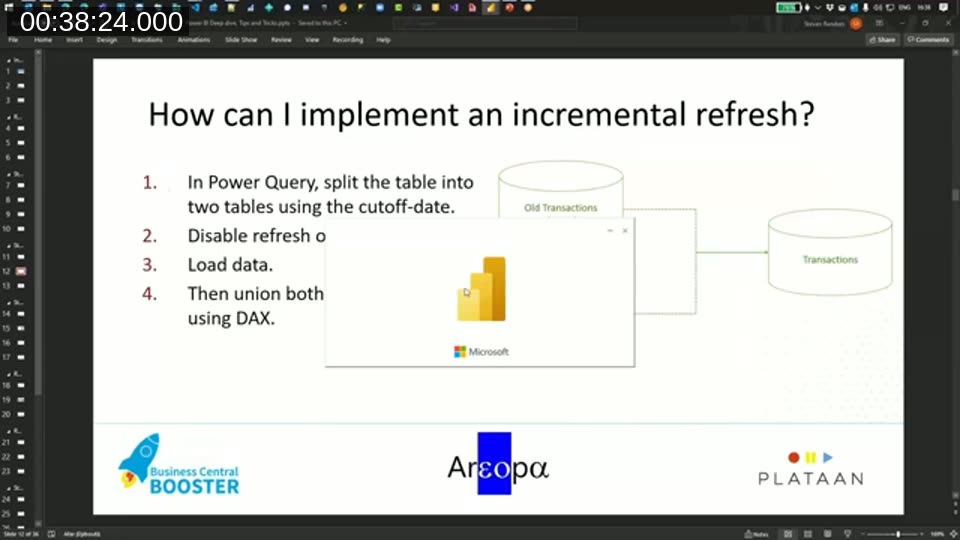
Steven shows a workaround instead: split the source table into a static table (older, unchanging entries filtered by a cutoff-date parameter) and a refreshing table (recent entries), disable refresh on the static table, and recombine both with a DAX UNION statement. He notes that doing the join in Power Query instead of DAX tends to work in Power BI Desktop but breaks on a scheduled refresh in the Power BI service.
📖 Docs: Configure incremental refresh and real-time data for Power BI semantic models — confirms that Power BI’s native incremental refresh policy relies on query folding, and that data sources unable to fold filters into the source query (such as OData) require workarounds like the one shown in this webinar.
Linking Actuals and Budgets
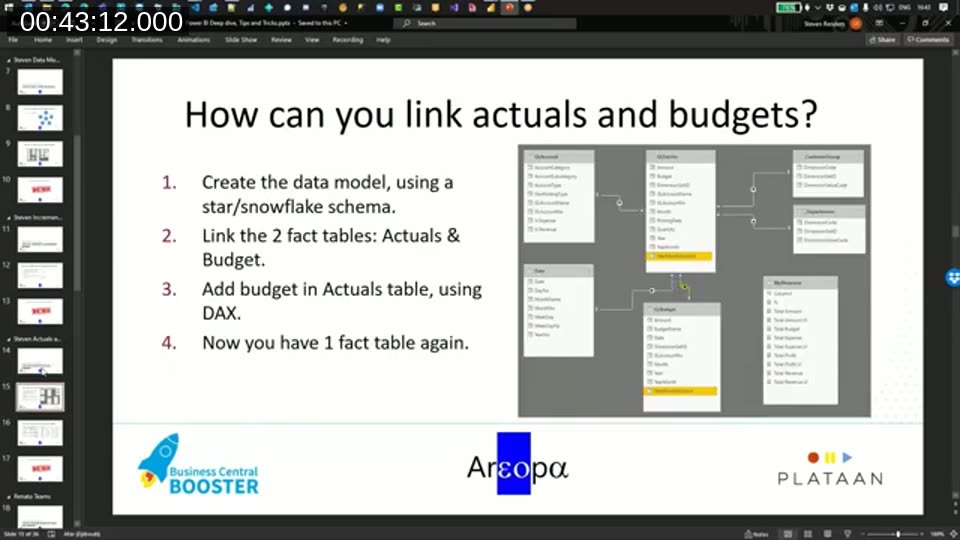
A star schema works best with a single fact table, which becomes a problem once both actuals (GL entries) and budget entries need to be analyzed together as two separate fact tables. Steven walks through three options: draw a direct relationship between the two fact tables if one exists; merge the two tables together; or, when no clean relationship exists, build a new fact table via a cross join on the common dimensions (date, GL account, and so on) so every combination of actual and budget records can be linked back to a single point in the star.
Power Apps and Power BI: A Bi-Directional Integration
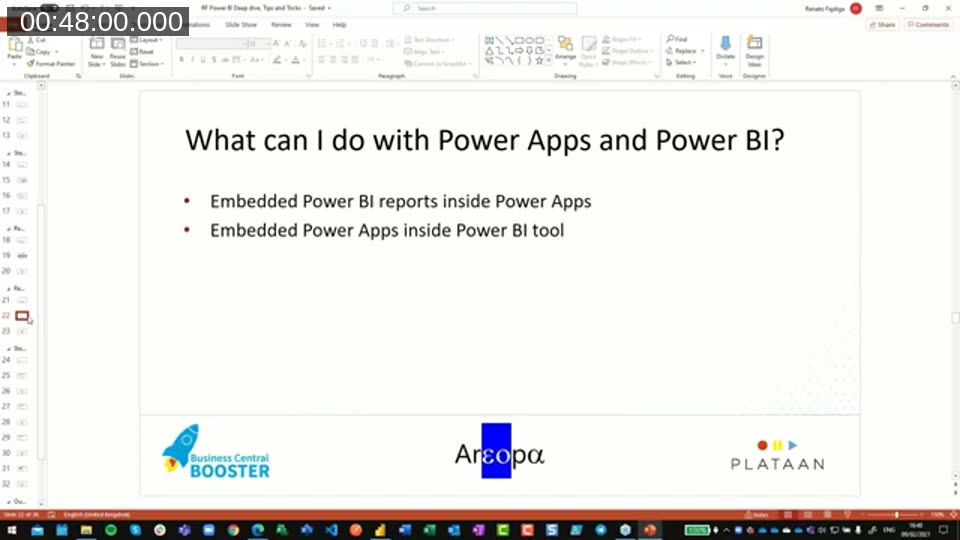
Renato closes out the demos by covering how Power BI and Power Apps can embed each other. A Power BI report can be embedded inside a Power App — for example, so that browsing an item list automatically filters an embedded inventory-by-location chart. Conversely, a Power App can be embedded inside a Power BI report, giving report viewers a way to update the underlying Business Central data (such as master data or inventory records) directly from the report.
In the demo, filtering is achieved by pointing the embedded Power BI visual’s URL at the correct report and setting the filter field (item number) to match the value selected in the Power App gallery.

Embedding Power BI Reports Directly in Business Central
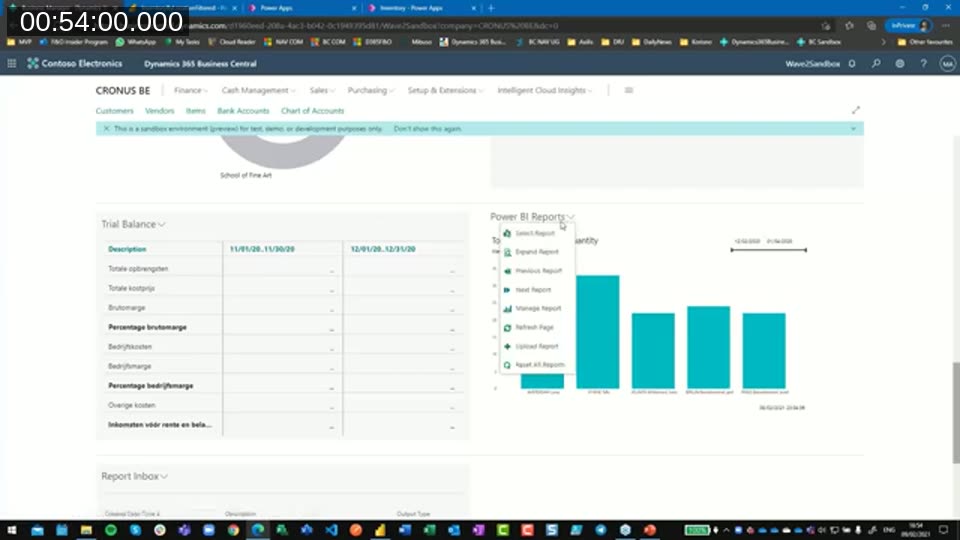
Renato also shows the reverse integration: Power BI reports can be embedded directly into Business Central pages and role centers via the standard Power BI Reports part. Users can select a report, filter it by a field such as item number so it follows navigation through a list, or open the full Power BI editing experience without leaving Business Central to adjust visuals and colors.
Q&A Highlights
During the live Q&A, Steven and Renato addressed a few follow-up questions from the moderator:
- Web services vs. APIs: the same fetching principles from the demos apply to API pages, but at the time of the webinar the Power BI/Business Central connector was still limited to roughly 20,000 entities when using APIs, with an expansion planned for a future release wave.
- Copying reports between workspaces: adding a report to a Power BI application creates a copy, not a reference — both copies need to be maintained separately. Steven mentioned that PowerShell-based Power BI APIs can be used to script and deploy reports (for example, through a DevOps pipeline) as a partial workaround, and that he had filed an idea on the Business Central ideas site asking Microsoft to add this capability to the admin API.
- Demo files: Steven offered to publish his demo files on GitHub after the session. No link was shared verbally or captured in the video description, so it isn’t included here — check the Areopa Academy site or reach out to the presenters directly if you’re looking for those files.
This post was drafted with AI assistance based on the webinar transcript and video content.