
In this Areopa Academy webinar, Luc van Vugt looks at test automation from an angle that gets far less attention than writing the tests themselves: how do you debug a test that fails, and how do you know that a test which passes is actually testing something meaningful? Moderator David Singleton hosts the session and steps in with questions along the way.
The business case: Extended Text on Assembly Documents
Luc builds the whole session around one example from his GitHub repository of test automation examples: adding the standard Business Central Extended Text feature to assembly documents. Extended Text already exists on sales, purchase, and service documents, and Luc’s sample app extends that same behavior to assembly quotes, blanket orders, and orders. The companion test app contains 72 tests, and the webinar uses a handful of them to demonstrate debugging and verification techniques.
📖 Docs: How to Use the Extended Text Feature in Microsoft Dynamics NAV — ArcherPoint’s explanation of the standard Extended Text functionality that Luc’s example extends to assembly documents.
Debugging your tests
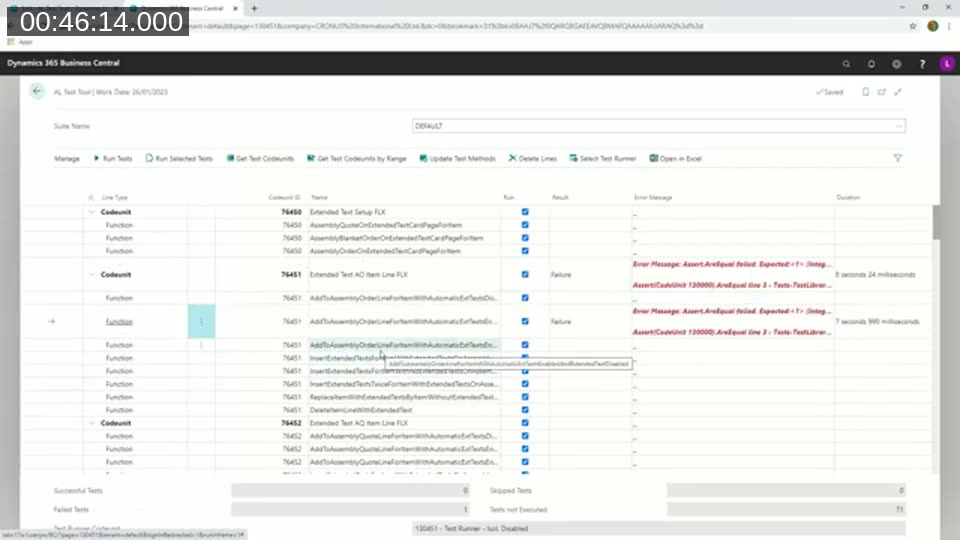
Luc opens with a straightforward point: AL test code is still AL code, so it can be debugged the same way as application code. He picks a failing test from his 72-test suite and starts from the AL Test Tool page, where the Error Message field stores both the error text and the full call stack.
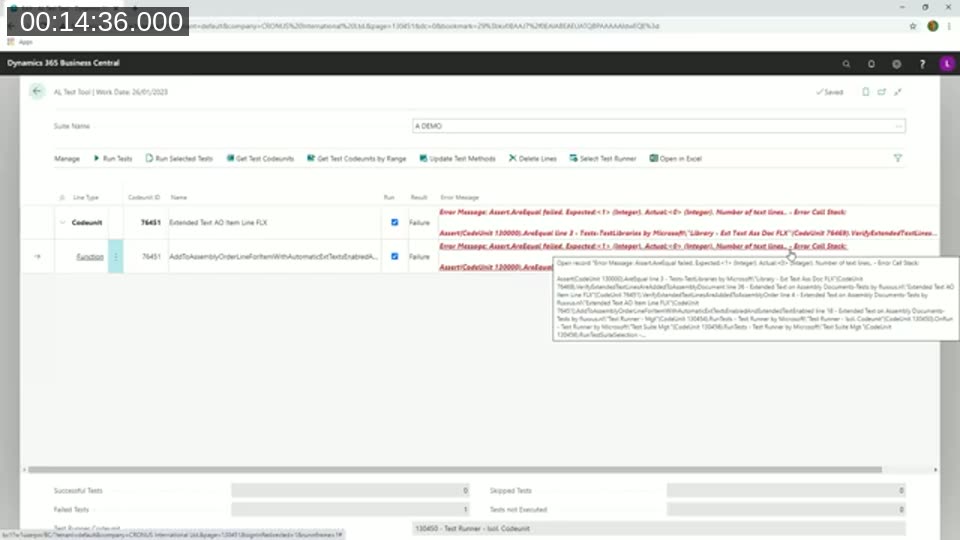
The failing test, AddToAssemblyOrderLineForItemWithAutomaticExtTextsEnabledAndExtendedTextEnabled, expects one extended text line to be created on the assembly order and gets zero. Luc points out the naming and comment structure he uses consistently across his tests and in his book: a scenario number, a readable test name, and Given/When/Then-style comments that separate the reusable “green” library code from the test-specific “black” code.
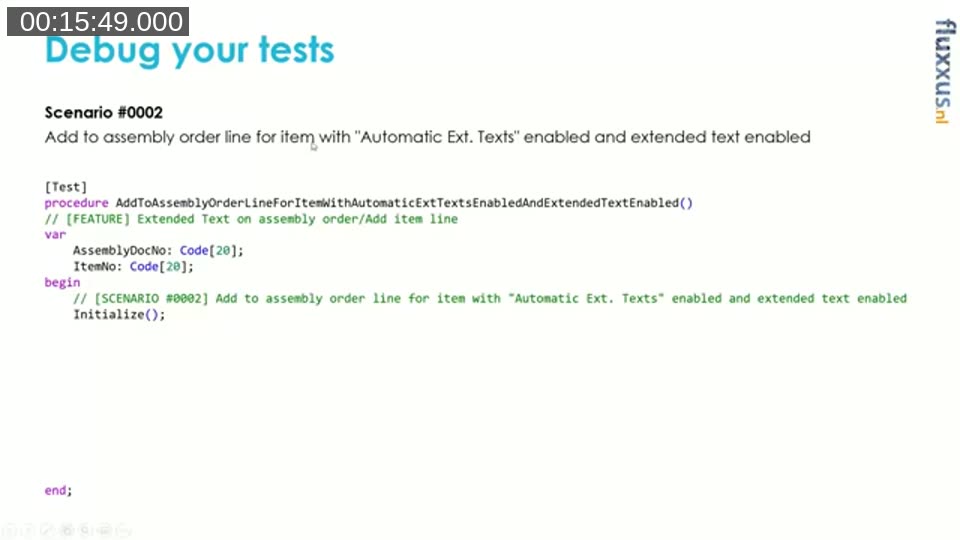
Running and debugging the scenario
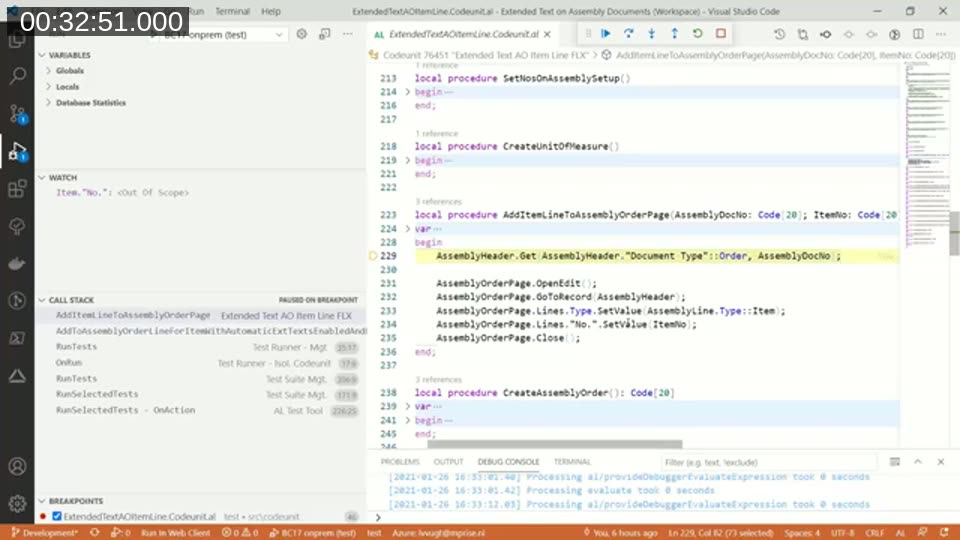
Stepping through the test in the VS Code debugger, Luc creates an item using standard library functions (numbers prefixed with GL or GU so test-generated data is easy to recognize), then uses a TestPage object on the assembly order to simulate a user filling in the item number on a line — because the logic that triggers the extended text lookup lives on the page, not the table.
📖 Docs: Test pages – Business Central — how the TestPage data type is used to simulate user interaction with fields, subpages, filters, and actions inside a test.
Luc notes that putting watches on individual variables in the debugger works, but it only gets you so far — variables passed by reference lose context once you step out of a procedure, and watching one field at a time doesn’t give a full picture of what’s happening in the database.
The power of SQL queries
Instead, Luc’s preferred technique is to run the test inside a debug session and query the underlying SQL Server database directly in SQL Server Management Studio, using a set of prepared scripts (item, extended text header, extended text line, assembly header, assembly line, and so on). This gives a full, customizable view of exactly what data has been created at each breakpoint — more than what fits in the debugger’s Variables pane.
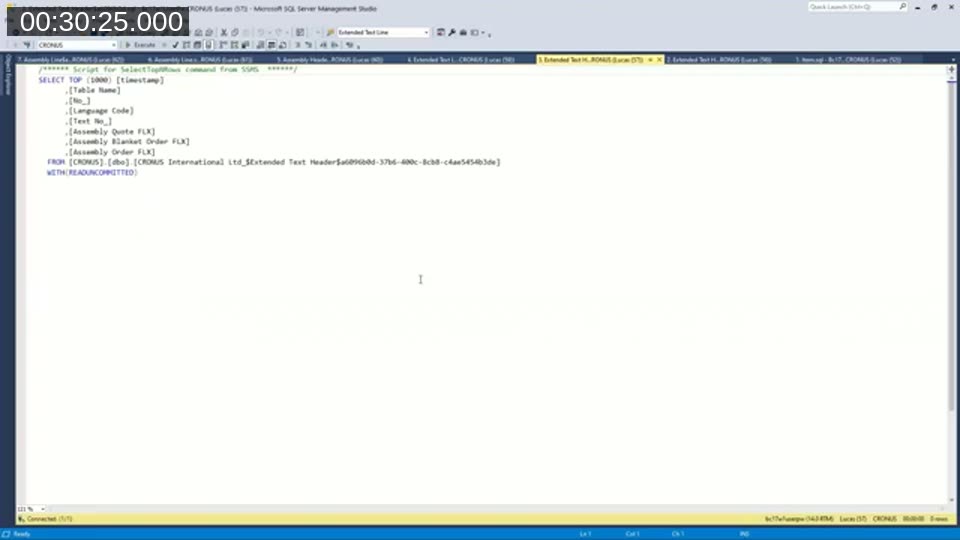
One detail matters here and comes up again in the Q&A: the queries need a WITH(READUNCOMMITTED) hint (or an equivalent read-uncommitted isolation level). Because the test runs inside an active transaction, a query without that hint will simply hang waiting for the transaction to commit. Luc also points out that the service tier caches some operations, so newly created records don’t always appear in a query immediately — a bit of patience, or a retry, is sometimes needed.
📖 Docs: Debugging in AL – Business Central — covers the AL debugger’s built-in SQL insights (enabled via enableSQLInformationDebugger), including executed statements, rows read, and locks held, as a built-in alternative to querying SQL Server directly.
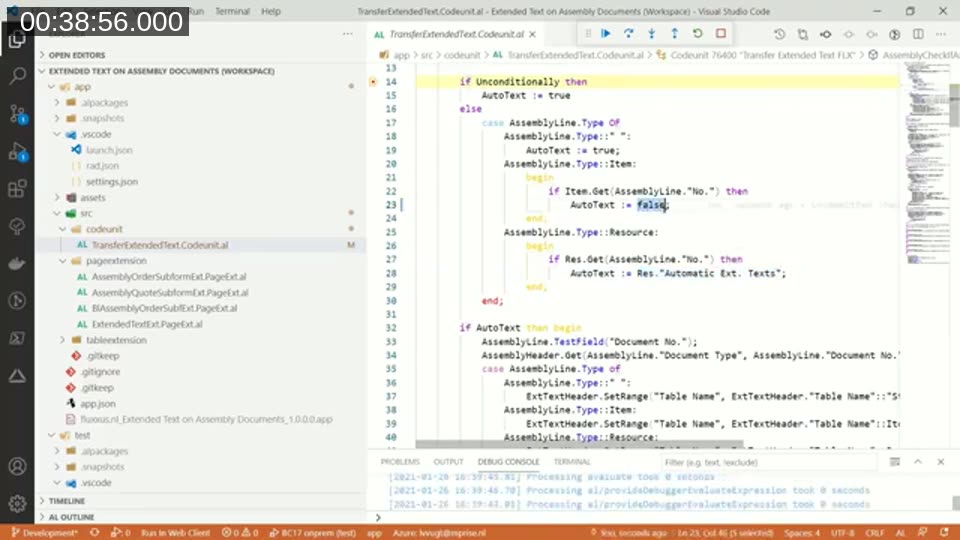
Continuing through the test, Luc finds that the assembly order line is created but no extended text line follows. Digging into the app code, he traces the call from the page’s OnAfterValidate subscriber into the extended text insertion logic and finds the actual bug: the code that decides whether to use automatic extended text reads the wrong source for items, hard-coding false instead of reading the value from the item record (the resource branch of the same logic does it correctly).
Call stack is your friend
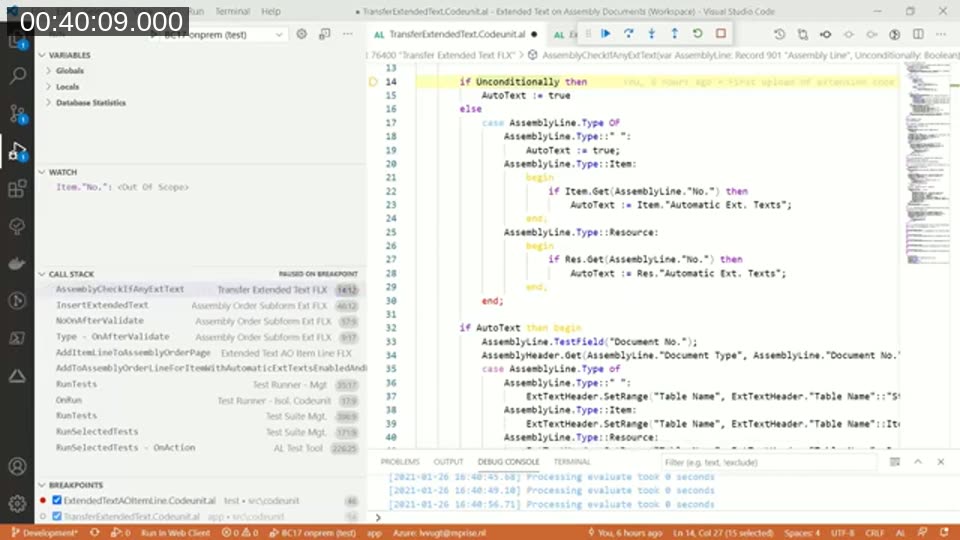
Luc calls the call stack one of the most valuable tools in the AL debugger. Reading from the bottom up, it always shows the test runner and test tool at the bottom, the test code above that, and — once execution reaches it — the application code on top. Following the call stack up from an error tells you not just where the app code failed, but whether the problem is actually in the test setup rather than in the application.
Validating your tests
The second half of the session addresses a different question: if a test passes, how do you know it’s actually testing what you think it’s testing? Luc offers two complementary approaches — checking the data that a test creates, and deliberately breaking a test to confirm it actually fails when it should.
Check the data being created
Luc demonstrates three ways to inspect the data a test produces:
- Run the test with a test runner that has test isolation disabled, so the data created during the test is not rolled back and can be reviewed afterward directly in the application.
- Run a debug session with isolation still enabled, and use SQL queries (as shown above) to inspect data while it’s still in the active transaction.
- Open a second browser tab against the same environment and refresh a relevant page while the debugger is paused, to see the in-progress data from the client itself.
📖 Docs: Test codeunits and test methods – Business Central — explains the TestIsolation property that controls whether each test method runs (and rolls back) in its own transaction.
Luc notes that the SQL Server option only applies to on-premises or containerized installations — in a SaaS environment, direct SQL Server access isn’t available, so checking data through the application (isolation disabled, or a second browser tab) is the only option.
Adjust the test so the verification errs
The second validation technique doesn’t involve debugging at all: deliberately change something in the test — an expected value in an Assert call, or a value used earlier in the test that the verification depends on — and confirm that the test then fails. If a “successful” test still passes after a value it depends on is changed to something clearly wrong, the test isn’t actually verifying that value.
Luc also flags the Assert codeunit itself, and the newer Library Assert codeunit that adds methods like IsTrue, IsFalse, and AreEqual. He recommends using these standard methods instead of writing custom checking logic, since they produce consistently formatted error messages that are easier to read when a test fails.
He closes with a reminder that “successful” only means “did not throw an error” — a test with no assertions in it at all will also report as successful. That’s exactly why the validation techniques in this session matter: a green test result is not proof that the test is meaningful.
Q&A highlights
David Singleton raises the importance of the READUNCOMMITTED hint used in the SQL queries, since without it a query against data from an in-progress test transaction will simply hang. The two also discuss whether debugging tests is a one-time activity or an ongoing part of the workflow — Luc confirms he uses the same debugging and validation techniques every time a breaking change comes in, not just when initially building out test coverage. He notes that a healthy suite of automated tests reduces the overall amount of debugging needed over time, since tests catch regressions before they require a manual debugging session.
This post was drafted with AI assistance based on the webinar transcript and video content.