
In this webinar, Kennie Pontoppidan (Microsoft) shows how Business Central partners can become more data-driven using telemetry, moderated by Luc van Vugt. The session centers on the free, open-source Power BI app for Business Central telemetry, which turns raw Application Insights data into ready-made usage, administration, error, and performance reports. Kennie walks through installing the app, connecting it to a telemetry resource, and using it from three different perspectives: implementer, tenant administrator, and technically-minded troubleshooter.
Why Telemetry, and Why Now
Kennie opens by explaining the rationale behind Business Central telemetry: as partners moved customers to SaaS, they lost the on-premises visibility they used to get from performance counters and server logs. Microsoft started emitting signals such as long-running queries, web service calls, and login telemetry to fill that gap.
Early on, the assumption was that simply providing raw data would be enough to make partners data-driven. Feedback showed otherwise: telemetry competes for attention with everything else partners need to learn, and there is a real distance between having data, having information, and having actionable insight. That feedback drove the development of samples, and eventually the Power BI app, to remove friction and get partners from “data” to “insight” in a few clicks.
The Business Central Telemetry Power BI App
The app is distributed as a template app on AppSource, published the day before this webinar. Being a template app means Microsoft can push updates that partners pick up automatically in Power BI, without reinstalling anything.
📖 Docs: Dynamics 365 Business Central Telemetry app on AppSource — the official listing Kennie installed during the demo.
After installing the app into a Power BI workspace, it opens pre-loaded with sample data. Kennie pointed out that this makes the app useful even before connecting real telemetry: it can be shown to a prospective customer’s IT manager or project sponsor during a pre-sales conversation, since the sample data illustrates exactly what a live report would look like without exposing any real customer information.
Connecting the App to Your Own Data
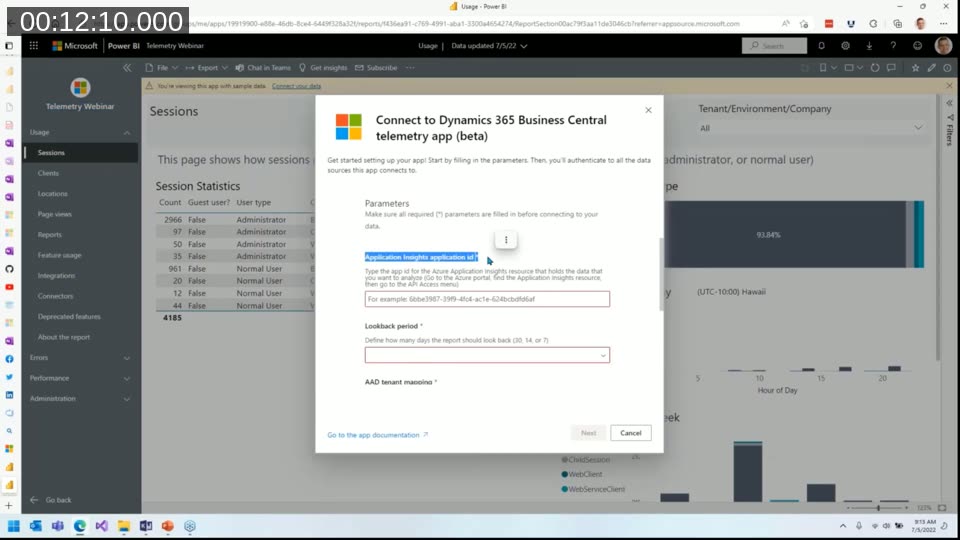
To move from sample data to a live telemetry resource, only two settings are required:
- Application Insights Application ID — found in Application Insights under API Access, then copied into the app’s connection dialog.
- Lookback period — how many days of history the app should query on each nightly refresh (Application Insights can retain data for up to two years, but the default retention is 90 days).
Two optional settings round out the configuration: an Azure AD tenant-to-customer name mapping (useful when multiple customers share one Application Insights resource), and a time zone override, since Business Central emits telemetry in UTC and the hour-of-day visuals will otherwise be skewed for customers outside that time zone.
Using the App as an Implementer: Usage
With the “implementer” hat on, Kennie walked through the Usage report, which is built around several pages that all follow the same pattern: a statistics table, categorized visuals, and time-based breakdowns (hour of day, day of week, calendar).
- Sessions — login counts by user type (guest, administrator, normal user) and client type (web client, background, web service).
- Clients — browser, device, and screen resolution breakdowns, useful input for UI or list-page design decisions.
- Locations — where users log in from, and which language locale they use in the client, which can surface an unplanned need for localized training material.
- Page views / Reports / Feature usage — which pages, reports, and features are actually used, both before go-live (as a proxy for user-acceptance testing) and after go-live (to follow up on whether the rollout’s intended processes are actually being used).
- Integrations / Connectors — which external systems and Microsoft connectors (Power Automate, Power BI, etc.) call into Business Central, and how frequently.
- Deprecated features — flags usage of Basic Authentication for web services, which was deprecated in Business Central online in version 20.0 and removed in 21.0. An empty report here means a customer has no lingering dependency on the deprecated auth method.
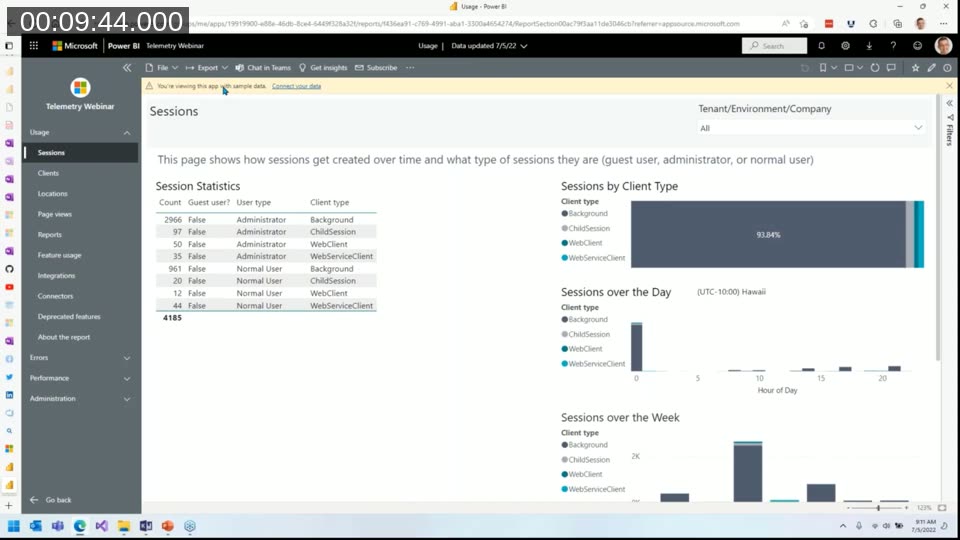
Global filters on tenant, environment, and company apply across the whole Usage report, so a partner managing multiple customers in one Application Insights resource can drill into a single customer’s data without mixing it with anyone else’s.
Using the App as a Tenant Administrator
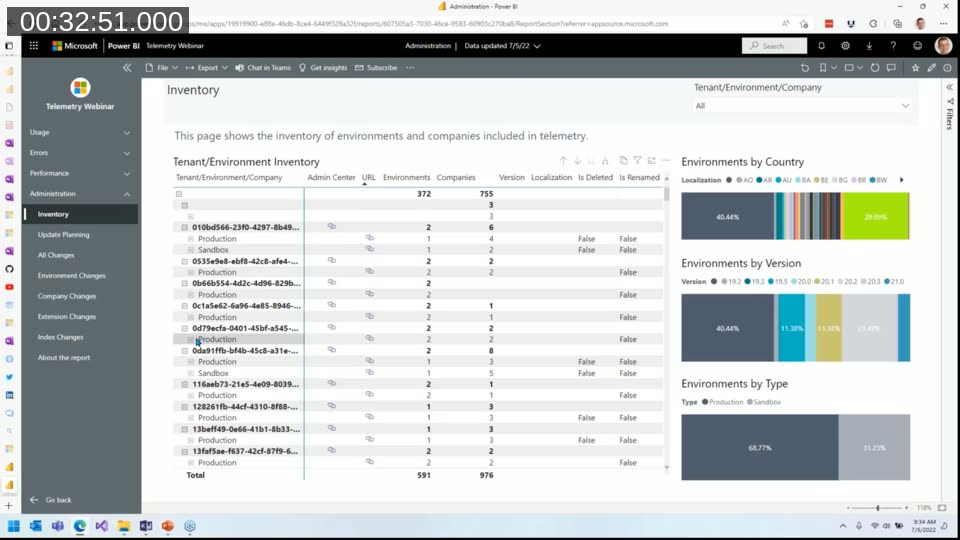
Switching to the administrator’s perspective, the Administration report gives an inventory of environments and tenants in the telemetry source: version, localization, and whether an environment has been deleted or renamed. For SaaS environments specifically, it also shows update planning — which environments are scheduled for an update, the current and target version, and Microsoft’s forced-update deadline.
A recurring administrator scenario is a customer reporting that “something changed” on a specific day. The All Changes report lets a partner filter to a date range and see lifecycle events at the environment, company, or extension level — for example, an applied hotfix, a point-in-time restore, a deleted company, or an extension update — to explain what actually happened.
Monitoring Errors
The Errors dashboard aggregates error counts across three categories: user errors (login failures, error dialogs, permission errors), integration errors (web service and connector call failures), and system errors (job queue, email, configuration package, and lifecycle failures).
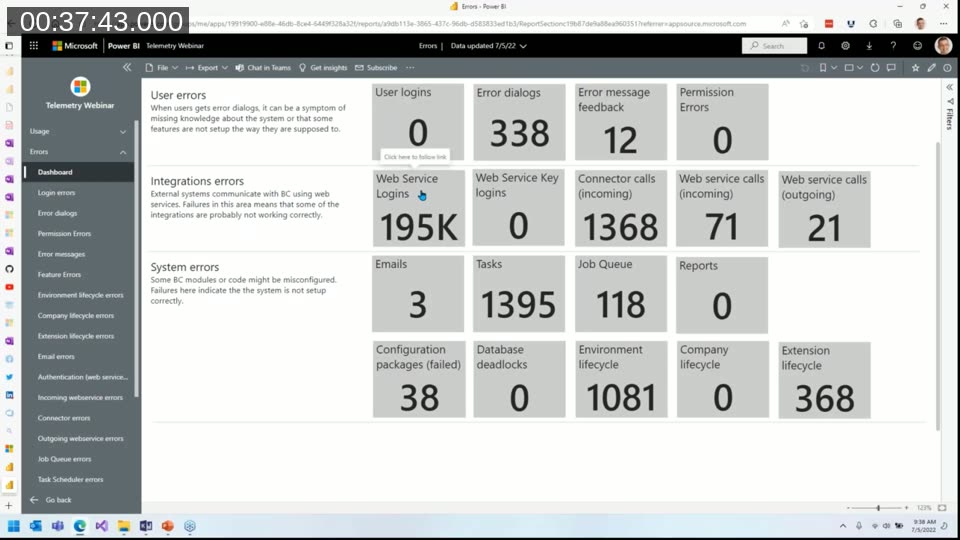
Kennie recommended driving these numbers to zero before go-live, then monitoring the dashboard closely in the first weeks after go-live. New in version 20.0, Business Central logs telemetry whenever a user sees an error dialog, including the AL call stack, so partners can trace an error back to the extension and object that raised it. Version 20.0 also added error message feedback (a thumbs up/down users can give on an error dialog) and the language it was shown in — useful for catching bad or mistranslated error text. Version 20.1 added permission errors as a further breakdown.
Performance Monitoring
Kennie spent less time on the Performance report, noting that performance data is more technical and would need its own session to cover properly. The Recommendations page distills known performance anti-patterns directly from telemetry — for example, flagging when the OnCompanyOpen trigger (which runs on every login) is taking longer than expected.
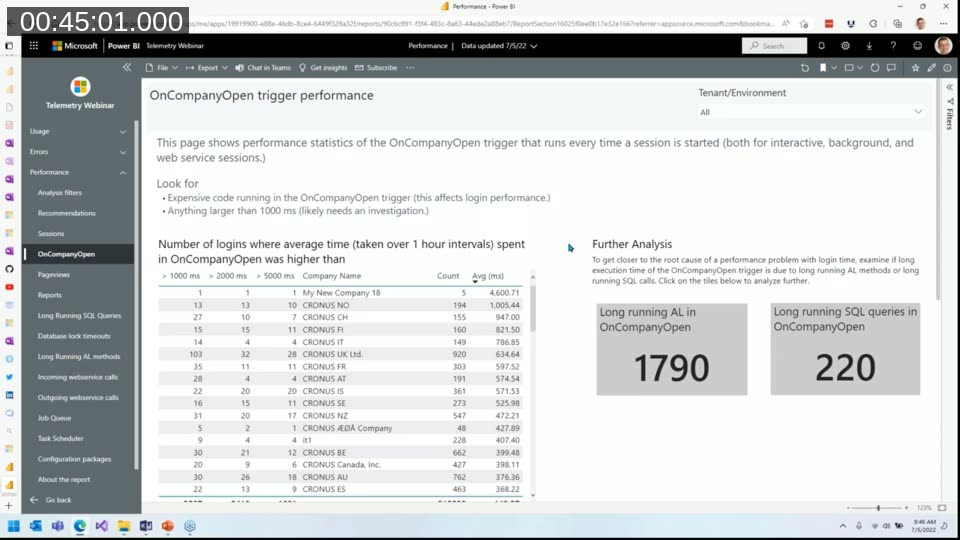
From there, a partner can drill into whether the slowness comes from long-running AL or long-running SQL, complete with call stacks, and see the underlying SQL statement, join count, and the number of table extensions or FlowFields contributing to it. Kennie also demonstrated the same pattern for other performance areas, such as long-running SQL queries and outgoing web service calls, each with its own “look for” guidance describing what counts as a problem.
Feature Telemetry for Custom Extensions
Partners and ISVs writing AL code can emit their own feature telemetry using the Feature Telemetry module in the System Application, without needing to build custom Power BI reports. Three logging methods are available: usage, error, and uptake (with phases undiscovered, discovered, set up, and used). The only setup required is implementing a small interface that defines what “logging” means for the extension, and subscribing to the relevant event.
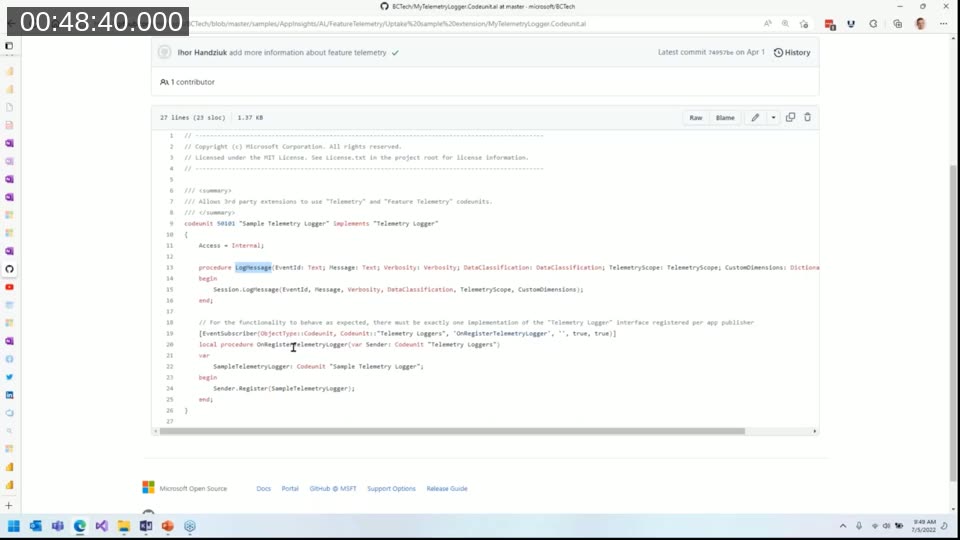
Once implemented, an extension’s telemetry automatically shows up in the app’s Feature Usage report, with no additional configuration needed — the same report also surfaces funnel and monthly-active-usage style views for any AppSource or per-tenant extension that instruments itself this way.
📖 Docs: Developing telemetry into your Business Central application — covers instrumenting AL code with the Feature Telemetry module and Session.LogMessage.
Setting Up Alerts
To be proactive rather than reactive, the app’s Alerts page shows how to configure alerting on top of telemetry: a condition, expressed as a KQL (Kusto Query Language) query, paired with a notification channel (email, Teams, phone, or a Logic App that posts to Slack, DevOps, or elsewhere). Sample KQL queries are provided for common conditions such as database regressions, available or failed environment updates, failed extension updates, and job queue failures.
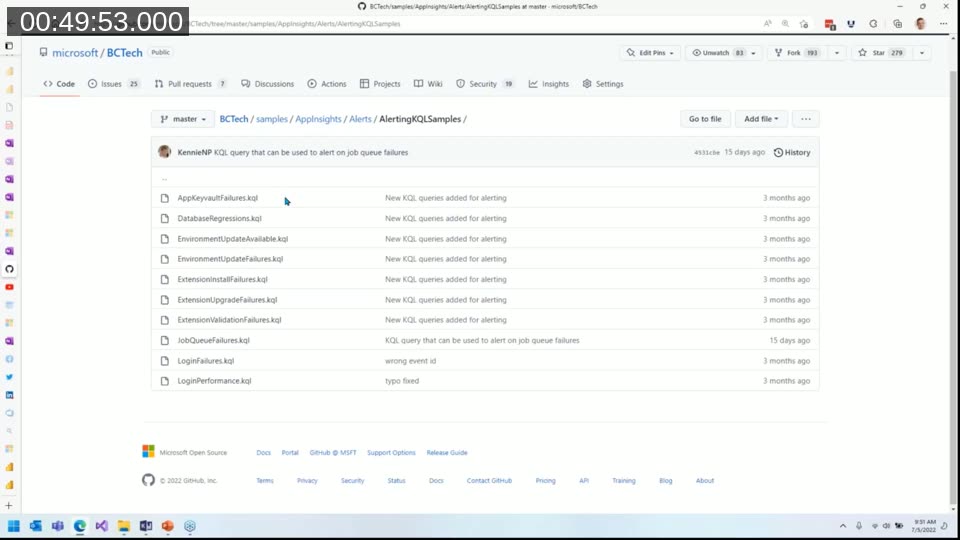
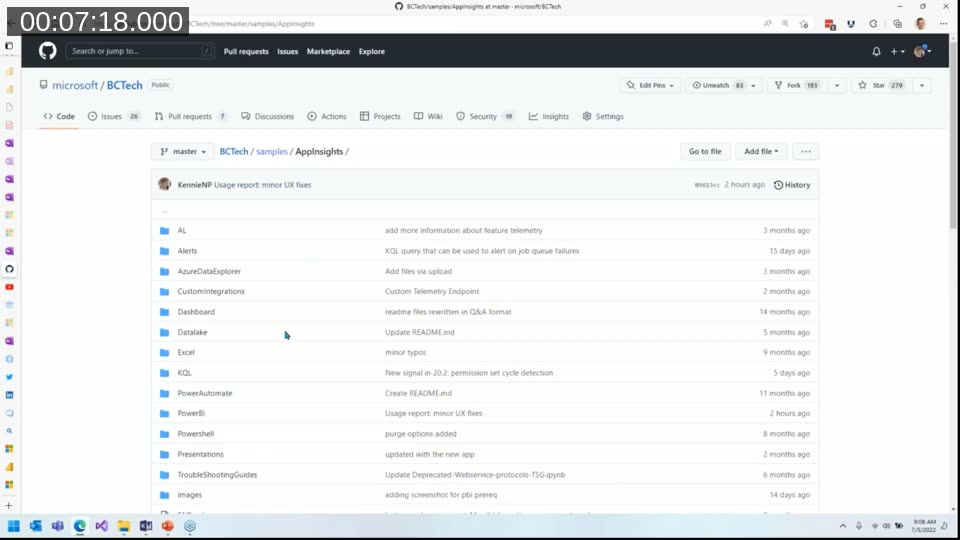
📖 Repo: BCTech/samples/AppInsights/Alerts — ready-to-use KQL alert queries for job queue failures, extension update failures, login performance, and more.
Getting Your Partner Practice Data-Driven
To close, Kennie shared a slide deck that adapts Gartner’s BI maturity model to a Business Central partner practice, moving through stages from “Unaware” toward becoming fully data-driven. For each stage, the deck lists characteristics to recognize and concrete advice split between a business sponsor (typically sales or implementation leadership) and a technical sponsor (developers and troubleshooters) — for example, an early “quick win” is simply showing the Usage report from the Power BI app to a business sponsor.
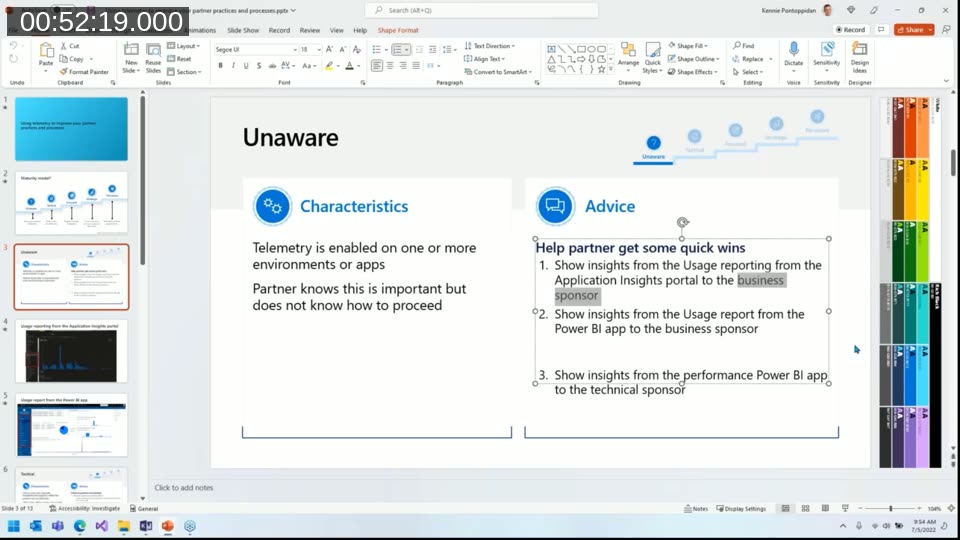
Both this maturity-model deck and a general “what is telemetry” introduction deck are available for partners to reuse internally or with customers.
📖 Repo: BCTech/samples/AppInsights/Presentations — includes “AppInsights telemetry for Business Central partners” and “Using telemetry to improve your partner practices and processes.”
Q&A Highlights
During the closing Q&A, two questions stood out:
- Can the error report be shared with customers? Since the app runs entirely in the partner’s own Power BI workspace, sharing it with customers or co-workers is entirely up to the partner. The BCTech repository documents how to share the report with co-workers and customers from within Power BI.
- Does enabling Application Insights affect performance? Kennie confirmed there is some overhead, as with any instrumentation, but Business Central sends telemetry asynchronously and buffers it efficiently on the platform, so the impact is not something users or customers are expected to notice.
📖 Docs: Monitoring and Analyzing Telemetry — the Microsoft Learn overview of how Business Central telemetry and Application Insights fit together.
This post was drafted with AI assistance based on the webinar transcript and video content.