In Areopa Academy webinar number 84, Tine Starič (Architect at Companial, presenting from Lithuania) walks through how custom code analysis can take the pressure off code reviewers in AL projects. Moderated by Luc van Vugt, the session covers what code analysis is, the tooling that already exists for Business Central, how to build your own analyzer in C#, and a long list of real-world rules Companial uses every day.
The trigger for Tine’s interest in linting came from her first project at Companial, where a German partner re-platforming an older solution to Business Central brought along strict legacy conventions — brackets around every if, capitalised EXIT statements, g-prefixed globals — that turned every pull request into a hunt for missing dots and brackets. “There must be a better way,” she remembers thinking. There is: linting, which the mature languages have had for years, and which AL supports too.
What code analysis is and why it matters
Code analysis is a way to examine source code before the program is run. Technically, an analyzer is a .NET library containing rules that the compiler validates source code against. Whenever the compiler walks the AL syntax tree and meets, say, a local variable, it raises an “event”; analyzer rules subscribe to those events and inspect the node — for example to check the naming.
The payoff is concrete: higher code quality, faster discovery of mistakes, standardised code, and a meaningfully shorter feedback loop between reviewer and developer. Less back-and-forth means features ship to customers sooner.
Docs: The code analysis tool — Microsoft’s overview of how the AL Language extension runs analyzers in the background and surfaces diagnostics in VS Code.
Existing solutions
Jump to this moment in the video.
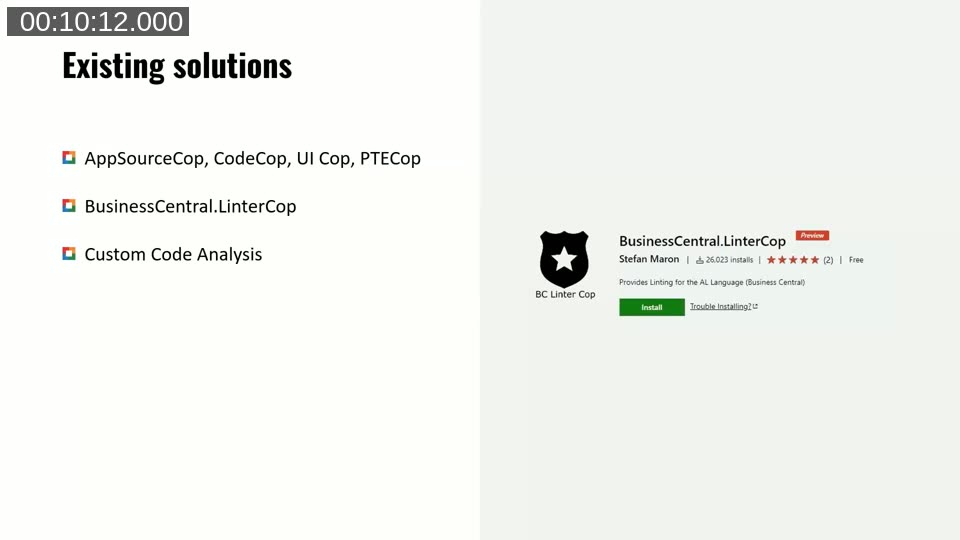
Three categories of analyzers are available to AL developers today:
- Microsoft’s built-in cops —
AppSourceCop,CodeCop,UICopandPerTenantExtensionCop. These ship inside the AL Language extension and cover the obvious things: missing action images, missing AppSource prefixes, per-tenant rules. - BusinessCentral.LinterCop — a community-driven analyzer originally started by Mark Brummel, later taken over and grown by Stefan Maron, and at the time of the webinar containing over 50 rules. (When Tine first encountered it, it had about eight.) She also gives a shout-out to Arthur van de Vondervoort, who has been driving the project forward and helping move rules from CompanialCop into the community project.
- Custom code analysis — when the four cops and LinterCop still don’t match your organisation’s conventions, you write your own.
Picking up LinterCop is essentially one click: search the VS Code marketplace for the BusinessCentral.LinterCop extension, install it, and the AL CS shortcut at the bottom of the VS Code status bar lets you enable LinterCop alongside CodeCop, UICop and the rest. Once enabled, you start getting warnings for the extra rules immediately. The source code, releases (compiled DLLs for use in pipelines) and the full rule list all live at github.com/StefanMaron/BusinessCentral.LinterCop.
Docs: Using the code analysis tools with the ruleset — how to override severities (warning, error, info, hidden) for individual rules per project via ruleset.json.
Tine encourages anyone using LinterCop to participate: open issues for problems, pull requests for new rules, and even just discussion-tab comments if you have an idea. “When the discussions get enough traction, maybe somebody else from the community will pick it up and implement it.”
Building your own custom analyzer
When even LinterCop isn’t enough, you write a custom analyzer. Companial’s own is CompanialCop, originally forked from LinterCop a few years ago and still kept as an addition to it — rules that prove broadly useful are migrated back to the community project over time.
The maintainability disclaimer
Before any code, an important caveat: custom code analysis is not officially supported by Microsoft. There is no documentation specific to AL analyzers, and you cannot Google “how to implement a new rule for AL analyzers” and find an answer. The good news is that the framework very closely follows Roslyn analyzers, so the C# Roslyn documentation applies in about 95% of cases.
The unsupported status also means Microsoft will happily break custom analyzers with each major AL language version. Plan for maintenance every April and October when the AL language gets updated.
Fixing the AL-version break
Jump to this moment in the video.
The fix is mechanical. Three references in the analyzer project always break with new AL versions:
Microsoft.Dynamics.Nav.Analyzers.CommonMicrosoft.Dynamics.Nav.CodeAnalysisMicrosoft.Dynamics.Nav.CodeAnalysis.Workspaces
You replace them with the fresh DLLs from the new AL language extension, which live in:
%USERPROFILE%\.vscode\extensions\ms-dynamics-smb.al-<version>\bin\AnalyzersCopy the three DLLs into your project, rebuild, and the analyzer works with the new AL version. Note that an analyzer built for AL 13 will no longer work with AL 12 — you build for one version at a time.
A worked example: ToolTipPunctuation
Jump to this moment in the video.
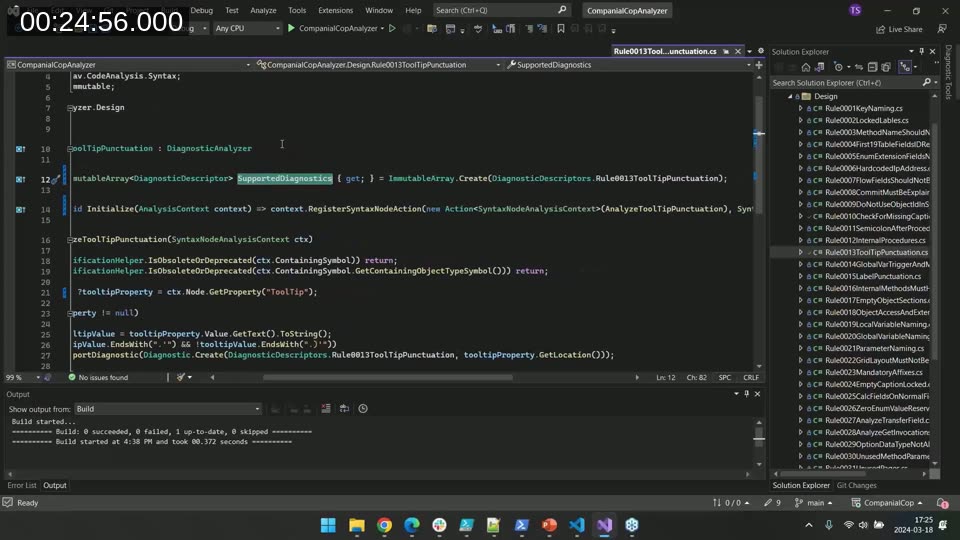
The walk-through uses CompanialCop rule 13, which checks that every tooltip ends with a dot. Each rule has two parts.
1. The diagnostic descriptor — a container for metadata about the rule: ID, message title/format/description and default severity. The ID is a two-character prefix plus a sequential number. The prefix must be exactly two characters, otherwise the analyzer won’t work properly in pipelines. CompanialCop pulls strings from a .resx resource file (CompanialCopAnalyzer.resx), but you can just as easily hard-code them while learning. The default severity (Warning, Error, Info) can always be overridden later through a ruleset.json file in the consuming project.
2. The analyzer class — inherits from DiagnosticAnalyzer and overrides two members:
SupportedDiagnosticstells the compiler which warnings to expect from this class.Initializesubscribes to the relevant compiler “events” viaRegisterActioncalls.
For the tooltip rule:
context.RegisterSyntaxNodeAction(
    new Action<SyntaxNodeAnalysisContext>(AnalyzeToolTipPunctuation),
    SyntaxKind.PageField,
    SyntaxKind.PageAction);
This says: “Whenever you find a syntax node of kind PageField or PageAction, call my AnalyzeToolTipPunctuation method.” (Tine notes that with version 24, table fields also get tooltips, so the rule needs to be extended to handle TableField too.) There are several other registration entry points — RegisterSyntaxTreeAction, RegisterCodeBlockAction, RegisterSymbolAction, and so on — all documented in the Roslyn reference.
The analysis method itself is short. Every CompanialCop rule starts with two guards that skip work if the containing symbol or the containing object is obsolete (that code is going out of the codebase anyway). Then it fetches the ToolTip property from the syntax node and, if present, checks whether the value ends with a dot — or with a dot followed by a closing parenthesis — and otherwise reports a diagnostic:
context.ReportDiagnostic(
    Diagnostic.Create(
        DiagnosticDescriptors.Rule0013ToolTipPunctuation,
        toolTipProperty.GetLocation()));
The location is used for the squiggly line in the editor.
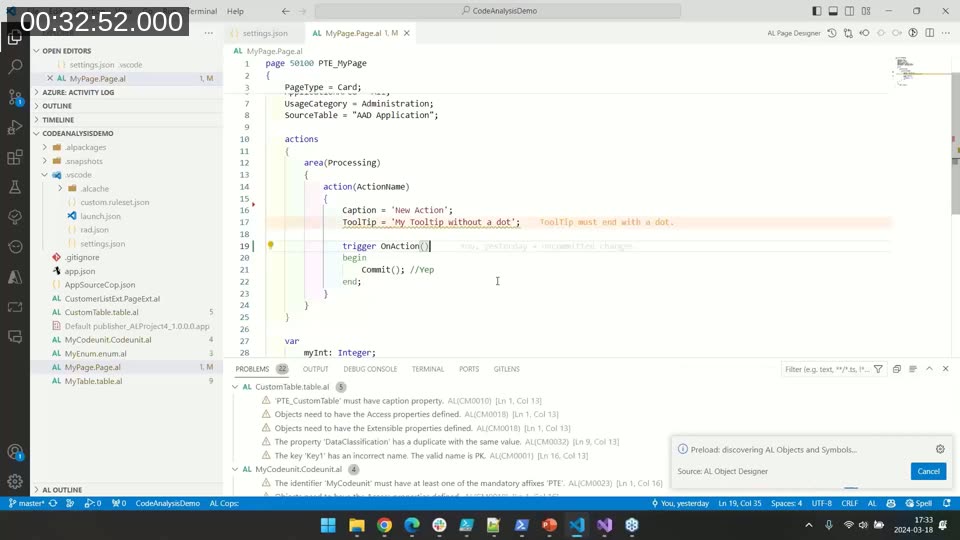
Loading the analyzer into VS Code
Jump to this moment in the video.
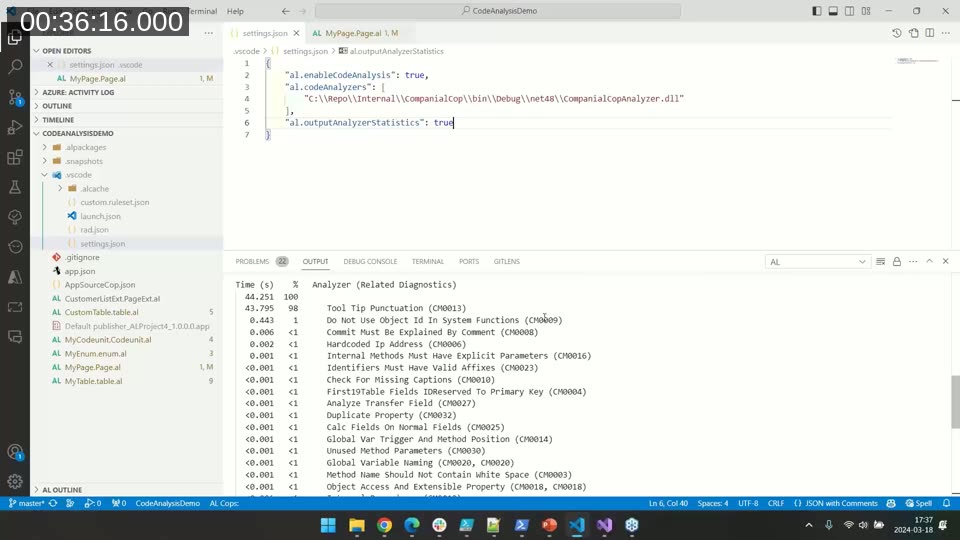
After Build > Build Solution in Visual Studio, the compiled DLL appears under bin\Debug\<net-version>\CompanialCopAnalyzer.dll. To use it in an AL project, point the AL Language extension at it in a .vscode/settings.json:
{
  "al.enableCodeAnalysis": true,
  "al.codeAnalyzers": [
    "C:\\Repo\\Internal\\CompanialCop\\bin\\Debug\\net48\\CompanialCopAnalyzer.dll"
  ],
  "al.outputAnalyzerStatistics": true
}
Reload the project so VS Code picks up the new analyzer, and the squiggly lines appear: “Tool tip must end with a dot.”
The third setting, al.outputAnalyzerStatistics, is worth highlighting on its own. When enabled, every build prints the time each individual rule consumed during analysis. Tine uses it whenever a new rule is added — running it against a larger project to verify it doesn’t add a noticeable performance penalty. Slow rules nobody wants.
Debugging a rule
The analyzer DLL isn’t an executable, so you can’t just press F5. Instead, set a breakpoint on your rule, then Debug > Attach to Process and pick Microsoft.Dynamics.Nav.EditorServices.Host. (Have only one AL project open at a time — multiple VS Code windows mean multiple host processes and a guessing game about which to attach to.) Then either edit a file or build the AL project; either triggers the breakpoint, and you can step through to inspect what properties the syntax-node context actually exposes. With no official documentation, the debugger is how you learn the API.
Integrating with development workflows
For new AL projects, Companial defines all code analyzers — Microsoft’s plus LinterCop plus CompanialCop — directly in the workspace file together with a shared rule set that turns on and off the right rules. New joiners immediately see the warnings they should see and not the ones they shouldn’t; the ruleset doubles as onboarding documentation.
Docs: AppSourceCop Analyzer Rules — the full list of AppSourceCop diagnostics and an example of usingAppSourceCop.jsonwithmandatoryAffixesto enforce naming on new objects.
On the pipeline side, BcContainerHelper fully supports custom code cops. Both Compile-AppInBcContainer and Run-AlValidation accept a customCodeCops parameter — you pass in the path to your DLL and your rules run there too. AL-Go for GitHub and ALOps also support custom cops.
Linting use cases from the wild
The last third of the session is a tour of real rules Companial has built and the bugs they prevent.
Run-time errors
Jump to this moment in the video.
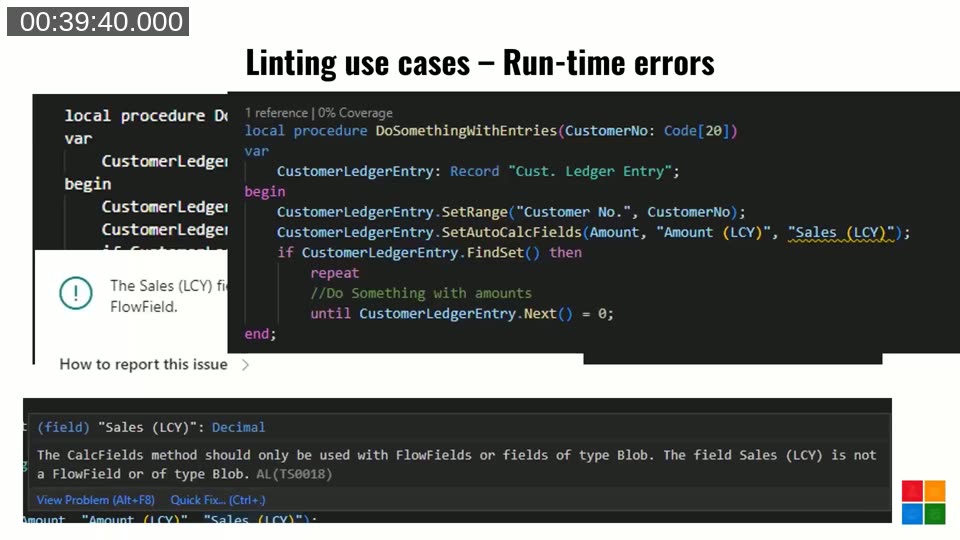
Most run-time error categories are already caught by Microsoft’s cops, but a few slip through. One example: calling SetAutoCalcFields on a field that isn’t a FlowField. The reviewer staring at the diff has no way to know — there’s no clue in the local change — but the user gets a runtime exception (“The Sales (LCY) field in the Customer Ledger Entry table must be a FlowField”). The real-world trigger was a developer who added a FlowField to a custom table, wired it into SetAutoCalcFields, then later decided it should be a normal field — and forgot to remove the SetAutoCalcFields entry. A static rule catches it.
Jump to this moment in the video.
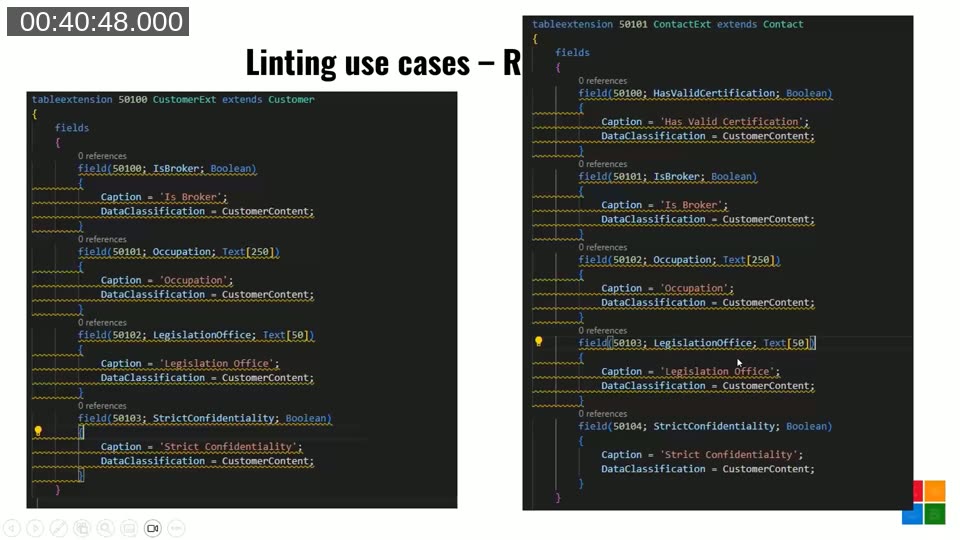
A second, more striking example: TransferFields collisions on coupled tables. Business Central has built-in functionality to create a customer from a contact via TransferFields, which moves data between fields that share the same ID. If two different developers, two months apart, both add custom fields to the contact and customer extensions and happen to land on the same ID with different types — Boolean on one side, Text[50] on the other — the next time anyone creates a customer from a contact, the system blows up.
You cannot catch that in code review without keeping every coupled-table pair in your head. Companial’s analyzer does. As an aside: Tine asks Luc to guess how many table pairs in BaseApp are coupled like that. The answer is 191.
Jump to this moment in the video.
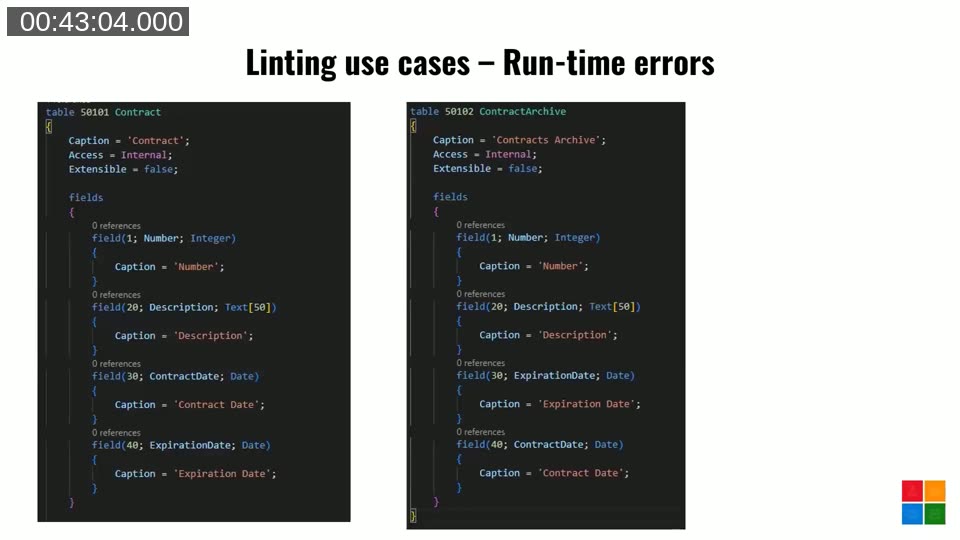
The same rule was extended to compare custom tables to their archive counterparts (e.g. Contract and ContractArchive). Even when types match, a functional bug can hide: if field 30 is ContractDate on one table but ExpirationDate on the other, TransferFields happily swaps them with no error. The rule asserts that matching IDs must also have matching names and types.
Maintainability improvements
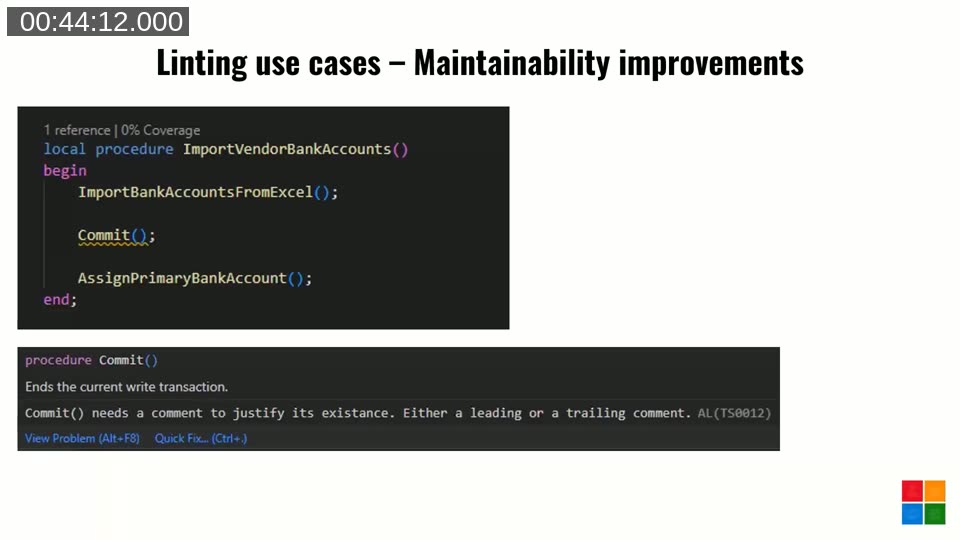
Jump to this moment in the video.
Coming back to your own code six or twelve months later is a recurring theme. Two examples:
- Commit needs a comment (this rule actually comes from LinterCop).
Commitis powerful when needed, but six months later nobody remembers why it was placed there. Requiring a leading or trailing comment forces the writer to explain. - Internal methods must be invoked with explicit parameters. When you see
MyRec.Insert();with no argument, you cannot tell whether the developer intentionally skipped the trigger or just forgot the parameter. Forcing the parameter (Insert(true)orInsert(false)) makes intent visible. The same rule applies toModify,Delete,DeleteAll,ModifyAll.
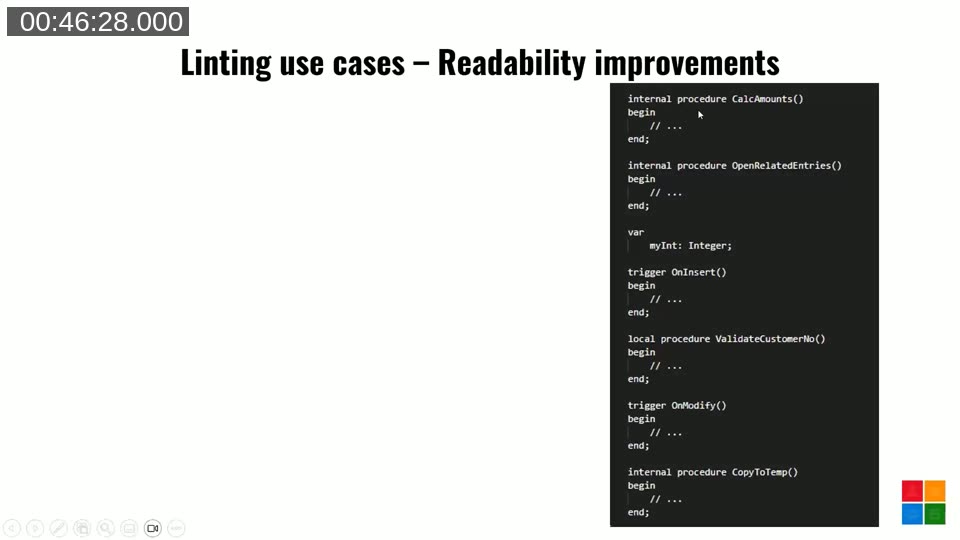
Extensibility, readability and coding conventions
For new AppSource-targeted extensions, Companial starts strict: every procedure must be local or internal, every object must be internal and Extensible = false. The AppSource process makes it painful to undo too-public surface area, so default to closed and open up case-by-case with pragmas as the extension matures. Once the extension is broadly extensible, the rules get turned off and the developer decides per-procedure.
A readability rule enforces a consistent order inside an object: globals first, then triggers, then methods. The cause of the mess — careless developer, sloppy merge — doesn’t matter; the squiggly line keeps it tidy.
Jump to this moment in the video.
Coding conventions are the more client-specific layer — globals prefixed with g, EXIT always capitalised — exactly the kind of micro-feedback that turns code review into a chore if it’s done by humans, and a non-issue if it’s done by a rule.
Nice-to-haves
Some rules add almost nothing technically but help keep the codebase uniform — for example, “don’t terminate procedure declarations with a semicolon,” or “empty captions should be locked” so they don’t bloat the translation file with strings nobody will ever translate.
Q&A highlights
- “Can I see the source of Microsoft’s cops?” Not in a repo, but the DLLs decompile cleanly with tools like dotPeek. Useful for “how did they implement this rule?” curiosity.
- “One of my code cops is faulty — does that block the others?” Not normally; the others should still run. One thing to watch: the pre-release AL language has recently jumped to 14 (with 13 still coming in April), and a custom cop built against the wrong target version can fail in surprising ways.
- “Can your custom rules be shared?” The CompanialCop source is on GitHub. Some rules are too Companial-specific to live in LinterCop, but anything broadly useful is migrated. Anyone is free to build their own DLL from the source.
Takeaways
- Turn on Microsoft’s analyzers. Then add LinterCop. See how much you get for free.
- Write down your team’s coding conventions. The ones you can describe in a sentence are usually the ones you can automate.
- If you write a useful rule, contribute it back — a pull request, an issue, or just a comment on a discussion. The whole community writes better code when LinterCop grows.
Resources
- BusinessCentral.LinterCop on GitHub — source, releases and rule list
- LinterCop issues & discussions
- CompanialCop on GitHub — Companial’s internal analyzer, free to use as a starting point
- stefanmaron.com — Stefan Maron’s blog (LinterCop maintainer)
- github.com/Arthurvdv — Arthur van de Vondervoort, prolific LinterCop contributor
- Microsoft Learn: The code analysis tool
- Microsoft Learn: Using rulesets with code analysis
- Areopa Academy — the webinar series
This post was drafted with AI assistance based on the webinar transcript and video content.