As AL projects grow in scope, so does the mental overhead of keeping everything straight. In this webinar, Christian Lenz—organizational designer and long-time Navision and BC developer at CTM Computer Technik Marketing—shares how the C4 model gave him a practical way to visualize Business Central solution architecture and communicate it clearly to developers and stakeholders alike. Moderator Gert Hector joins for Q&A. This session is an extended version of a presentation Christian originally gave at Directions EMEA 2025 in Poznan.
The Challenge: Chaos in Your Head
Christian framed his motivation around a concrete task: building a connector between Business Central and an external project management system (awork), following SOLID principles and the bridge app pattern. He had the concepts—interfaces, separate PTEs, dependency inversion—but no clear mental picture of how the pieces fit together.
Traditional architecture diagrams didn’t help. Searching for “software architecture diagram” returns an overwhelming variety of styles, symbols, and approaches. UML diagrams, ER diagrams, and BPMN-ish process flows each have their own notation, and without shared context they create more confusion than clarity.
“Too much design upfront is dumb — no design upfront is even dumber.”
— Scott Ambler
Introducing the C4 Model
The C4 model was created by Simon Brown and introduced in his widely watched GOTO 2014 talk “Software Architecture vs Code”. Christian encountered it at a two-day workshop Simon led in Amsterdam in 2022. The model has two core elements:
- A defined set of abstractions — shared vocabulary that removes ambiguity
- A defined set of diagrams — a consistent visual language derived from those abstractions
C4 does not reinvent UML. What makes it different is that every box and every line has a fixed meaning—there is no guessing what a symbol represents or what a connection implies.
📖 Docs: c4model.com — the official C4 model reference, with notation, examples, and tooling guidance maintained by Simon Brown.
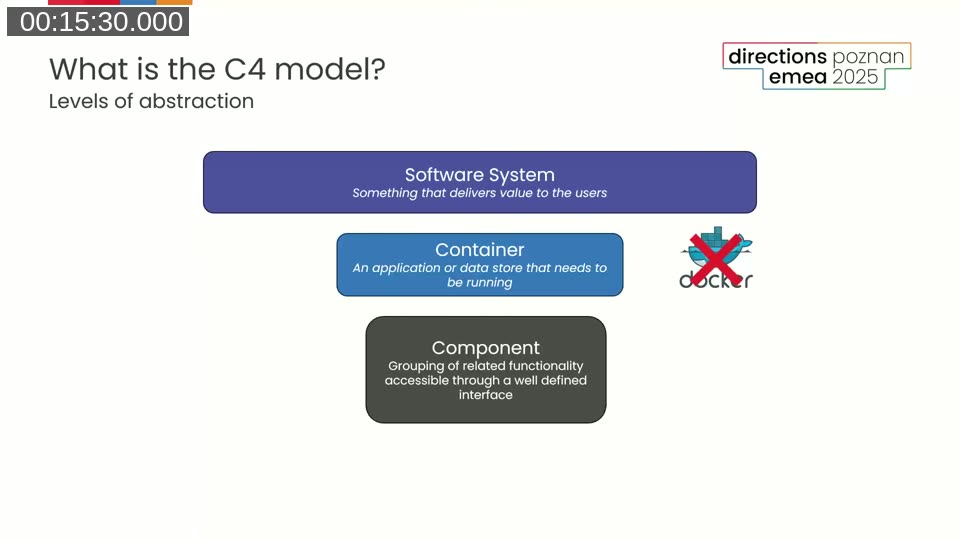
The Four Levels of Abstraction
C4 defines four nested levels, each zooming in one level deeper:
- Software System — something that delivers value to users as a whole
- Container — an application or data store that needs to be running (not Docker—this predates that usage)
- Component — a grouping of related functionality accessible through a well-defined interface
- Code — the classes, interfaces, enums, and functions that make up a component
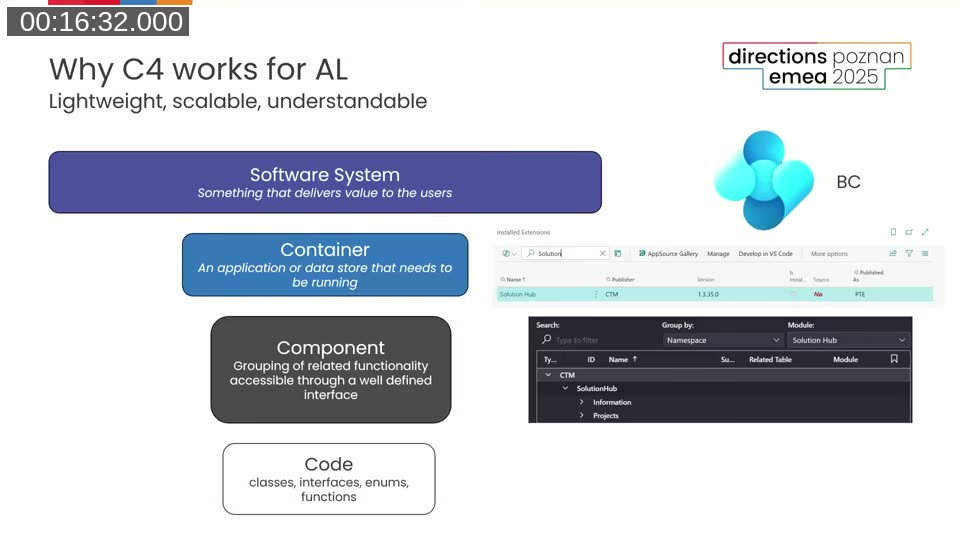
Mapping C4 to AL and Business Central
Christian mapped the four C4 levels directly onto the BC development world:
- Software System → Business Central (the system delivering value to users)
- Container → Extensions and PTEs (each a deployable unit that needs to be running)
- Component → Namespaces or logical groups inside an extension (e.g., a “Projects” component within the Solution Hub PTE)
- Code → AL files grouped into folders or namespaces
This mapping is lightweight. You don’t need specialized tools or a deep architecture background to start—the levels align naturally with how AL projects are already structured.
The Four Diagram Types
Each abstraction level has a corresponding diagram. The C4 model encourages starting at the highest level and zooming in only as far as needed for the audience.
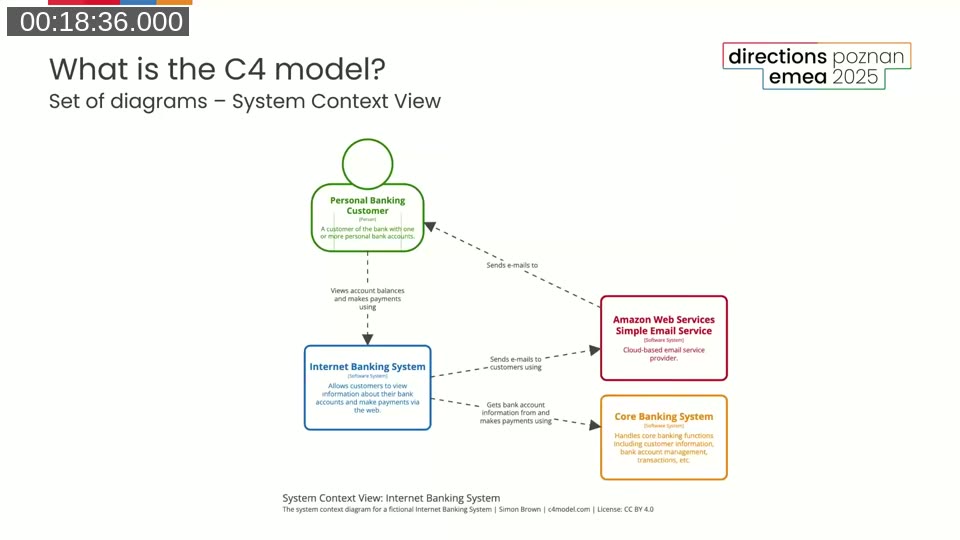
System Context Diagram
The System Context view answers: “What is this system, and what does it interact with?” It shows the system under focus, the users who interact with it, and the external systems it depends on or feeds data to. Every box includes a short text description of its purpose, and every relationship arrow has a label explaining what flows across it.
A diagram key in the corner defines what each box color and shape means—this turns out to be important when sharing diagrams across a team, because without it people may read the same diagram differently.
Container Diagram
The Container view zooms into a single software system to show the deployable units (extensions, services, databases) that make it up. For a BC solution, this is typically where you see which PTEs and AppSource apps are installed, how they relate to the Base App, and which external APIs they call.
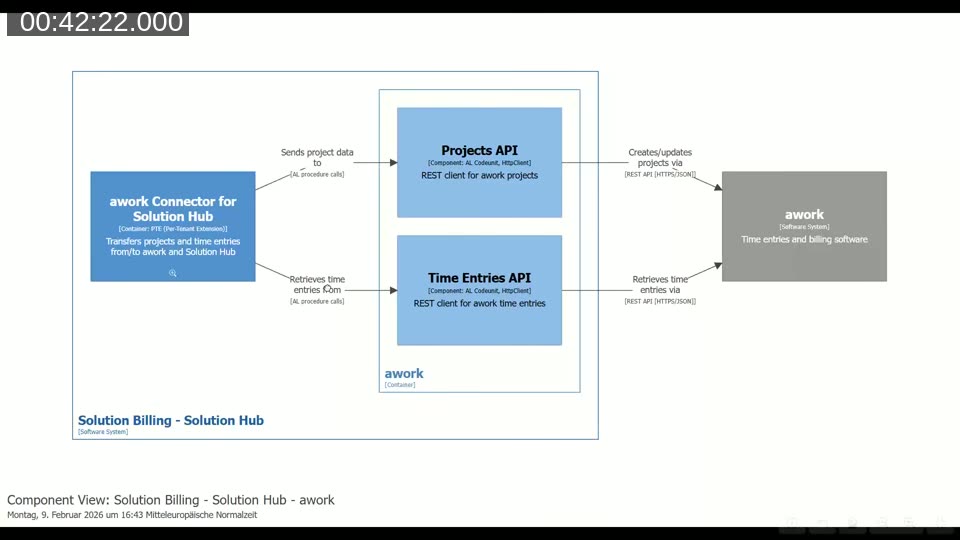
Component Diagram
The Component view zooms into a single container to show its internal structure—the namespaces, codeunits, interfaces, and enums that handle distinct responsibilities. Design decisions (such as which protocol to use for a given API call) are documented directly on the diagram arrows.
Code Diagram
The Code level shows the actual classes and interfaces inside a component. Simon Brown generally advises against maintaining these manually—they’re better generated from the codebase. Christian used them during the design phase to validate that his planned AL structure was achievable before writing any code.
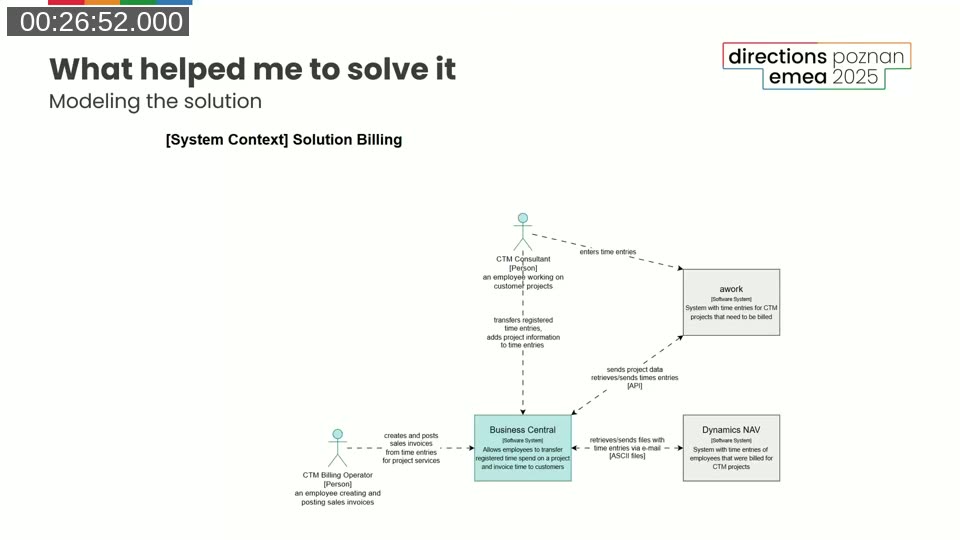
A Real Example: Solution Billing at CTM
Christian applied C4 to a real project: connecting Business Central with awork (a project planning and time registration system) to automate billing. Starting with draw.io and the built-in C4 shape library, he worked through each level of the model.
At the System Context level, the diagram shows Business Central at the center, the CTM Consultant and Billing Operator as user personas, and two external systems: awork (sending project data and time entries via REST API) and a legacy Dynamics NAV system (sending time entries via ASCII files).
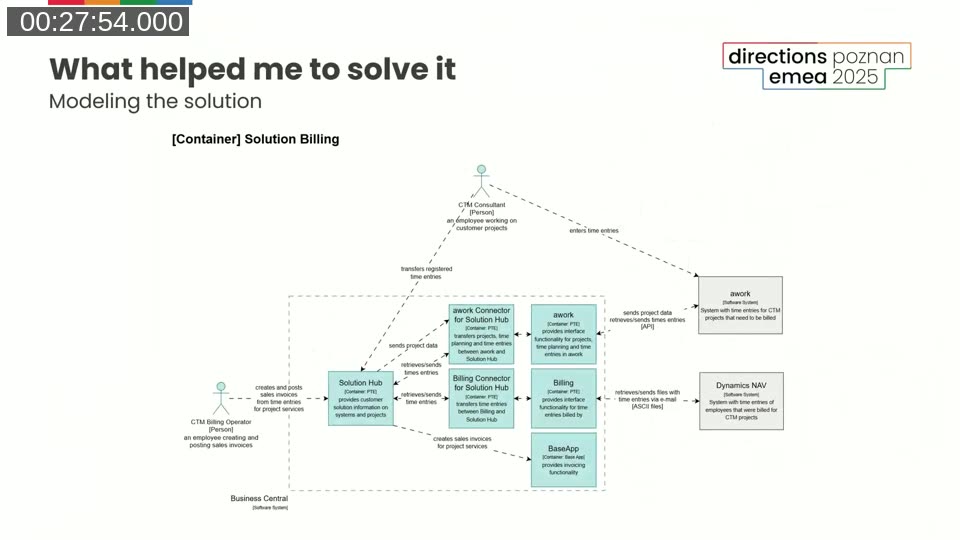
The Container diagram zooms into Business Central to reveal the bridge app architecture in action. Instead of putting all logic in a single PTE, Christian designed four separate containers:
- Solution Hub — core customer solution information (PTE)
- awork Connector for Solution Hub — the integration bridge between Solution Hub and awork (PTE)
- Billing Connector for Solution Hub — time entry import bridge (PTE)
- BaseApp — standard invoicing functionality
This structure means the connector PTEs are interchangeable. If the company switches from awork to another project management tool, the Solution Hub core remains unchanged—only the connector PTE is replaced.
At the Component level, the diagrams show how the Solution Hub PTE exposes an ISolutionProjectIntegrationProvider interface backed by an extensible enum—a textbook implementation of the Open/Closed and Dependency Inversion principles from SOLID. A test app mocks this interface to verify that new connectors integrate correctly without touching the core.
📖 Docs: Interfaces in AL — Microsoft documentation on declaring and implementing AL interfaces, the foundation of the extensible connector pattern shown in the webinar.
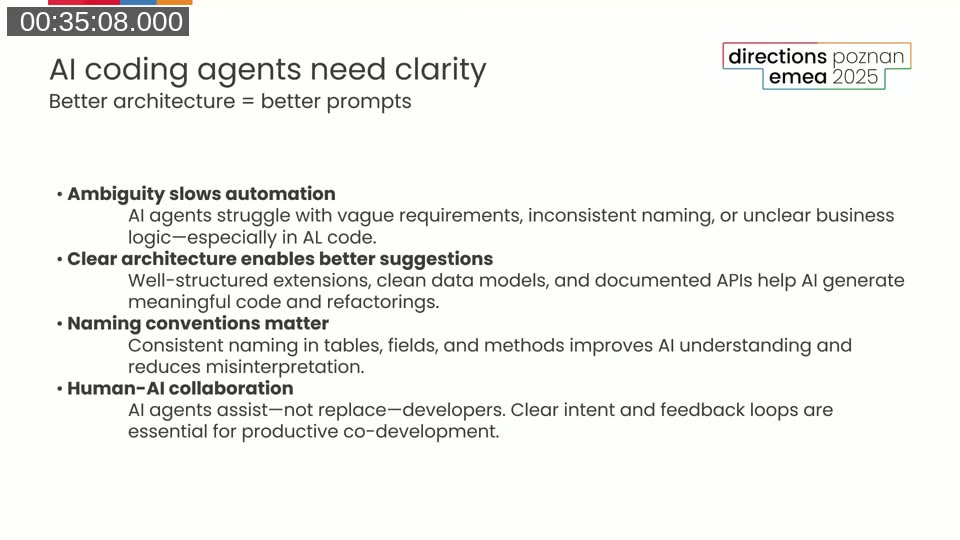
AI and Architecture: Better Architecture Means Better Prompts
Christian dedicated a section to the relationship between architecture clarity and AI coding tools. When architecture is well-defined, prompts to tools like GitHub Copilot become more precise—there is less ambiguity for the AI to guess at. When architecture is murky, AI suggestions drift in unpredictable directions.
He demonstrated this by pasting a component diagram screenshot into a Copilot chat and asking it to assess whether the architecture follows SOLID principles. Copilot correctly identified the Dependency Inversion Principle implementation, the Open/Closed extensible enum pattern, and offered specific concerns about Interface Segregation. He then asked Copilot to convert the diagram into a Structurizr DSL file—which it did, producing a working model from a screenshot.
Tooling: draw.io and Structurizr DSL
Christian recommended two tools at different stages of the process:
draw.io
draw.io (also available as a VS Code extension) includes a built-in C4 shape library. It is a good starting point for sketching diagrams quickly. The downside is that diagrams are stored as files and must be updated manually when the architecture changes.
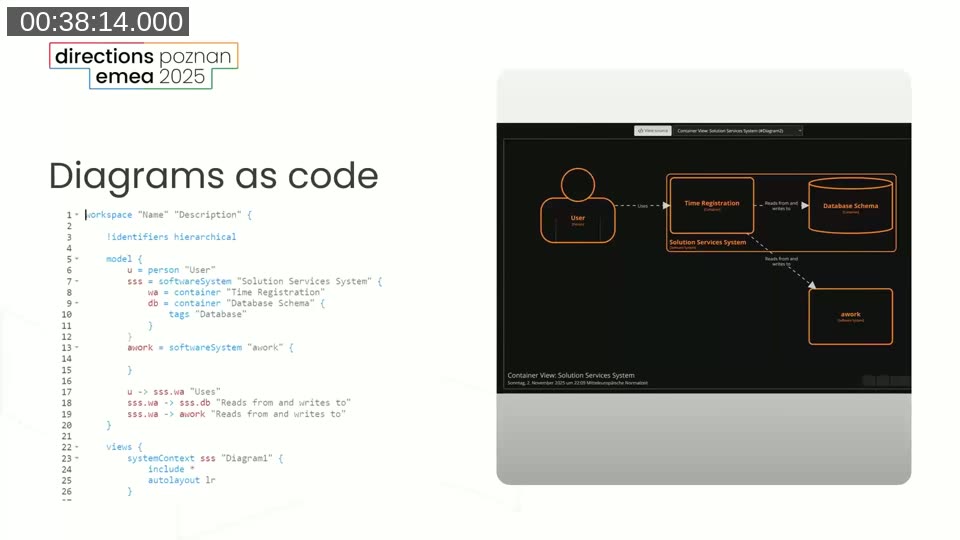
Structurizr DSL
Structurizr, created by Simon Brown, takes a different approach: architecture is defined in a domain-specific language, and all diagrams are rendered from that single source of truth. Change a system name in the model and every diagram that references it updates automatically.
The Structurizr DSL is plain text, which means it can be stored in a GitHub repository alongside the code. Christian demonstrated using the Structurizr online playground to paste the AI-generated DSL file and immediately see all diagrams rendered—System Context, Container, and Component views in one workspace.
📖 Docs: Structurizr DSL documentation — complete reference for the DSL syntax, including workspace definition, model elements, views, and styles.
Q&A Highlights
On Level 4 (Code diagrams): Gert noted that Simon Brown himself often advises against creating Code diagrams manually. Christian agreed—he used them during a learning phase to understand where interfaces and implementations needed to go, but doesn’t recommend updating them with every code change. Instead, he uses Copilot periodically to check whether the code still reflects the documented architecture.
On when to split into separate PTEs: A viewer asked whether internal work should be split into separate PTEs or kept within folders in VS Code. Christian’s advice: use the C4 model to reason through the decision before acting. Draw out the architecture, then “pull some of the plugs” mentally—ask whether removing a connector PTE would break the rest, and whether you need the flexibility to swap it in the future. The bridge app pattern is not a universal rule; it’s a design option worth considering when interchangeability matters.
This post was drafted with AI assistance based on the webinar transcript and video content.