In this Areopa Academy webinar, Krzysztof Bialowas (Microsoft Business Applications MVP, moderated by Luc van Vugt) covers telemetry for Business Central from an angle that goes beyond the usual troubleshooting story. Krzysztof works for an ISV and uses telemetry daily to understand how partners and customers actually use his apps. You’ll learn what telemetry is, how to set it up, what questions it can answer for ISVs and VARs, where its limitations are, and how to work around the 90-day retention limit with Power Automate, Azure Storage tables, and Power BI.
What is telemetry, and why do you need it?
Telemetry is the automated communication of data from multiple sources back to a central system. For Business Central, that means signals about installs, page views, report usage, job queue runs, and more, sent to Azure Application Insights. Krzysztof splits the value of telemetry into two categories: troubleshooting, which most partners already associate with telemetry, and business value, which is the less obvious but arguably more important side.
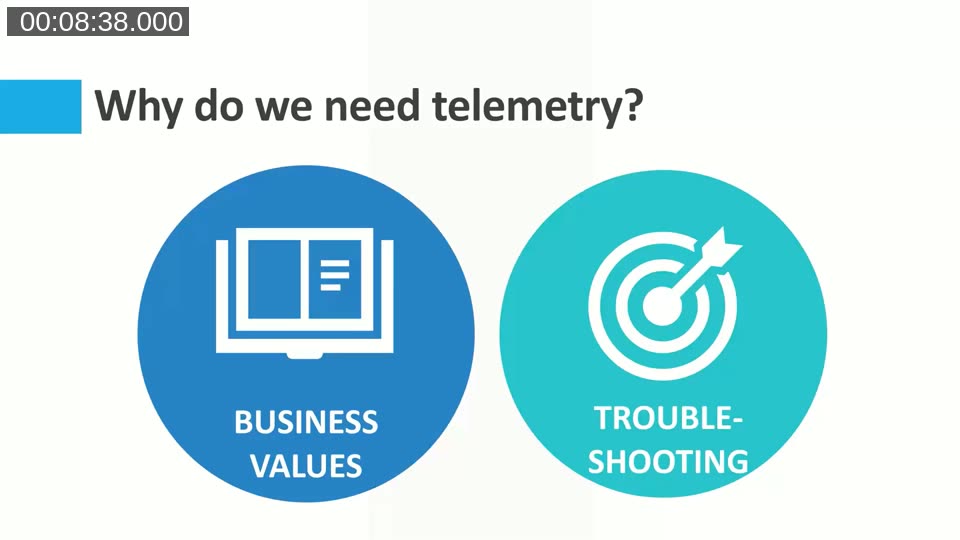
Only a minority of partners currently use telemetry, according to Krzysztof. Beyond fixing bugs, telemetry lets ISVs and VARs monitor customer experience, application health, quality, and performance, and — most importantly for this session — understand how software is actually being adopted.
Application Insights: the tool behind Business Central telemetry
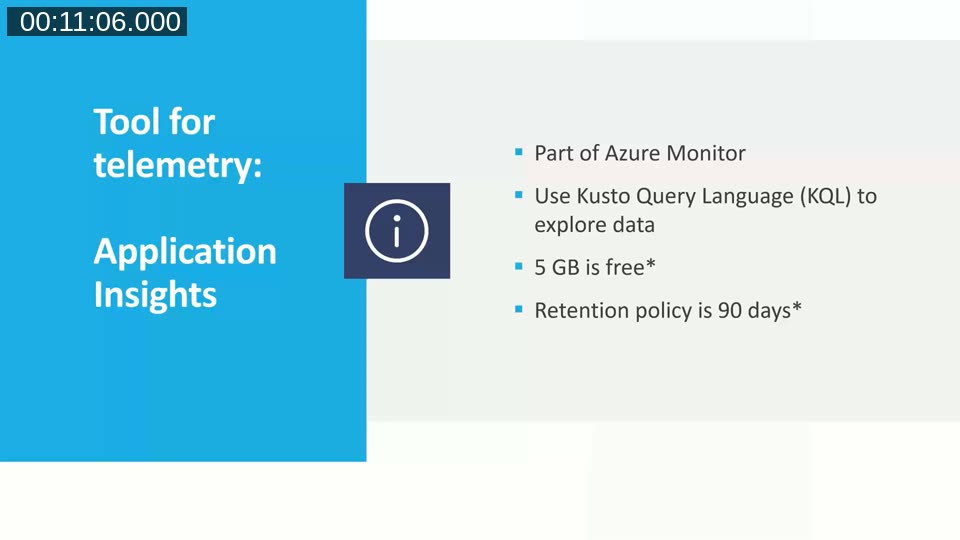
Business Central telemetry flows into Azure Application Insights, part of Azure Monitor. Data is queried with Kusto Query Language (KQL). Two numbers matter when you plan a telemetry setup:
- 5 GB of data ingestion per month is free — enough for most extensions unless you have a very high volume of connections.
- Data is retained for roughly 90 days by default.
There are two ways to connect Business Central to Application Insights. VARs add the Application Insights connection string in the Business Central admin center, so telemetry starts flowing for that tenant immediately. ISVs (or anyone building a PTE) add the connection string to their extension’s app.json, which also sends telemetry from sandboxes and Docker containers, not just production.
📖 Docs: Turn sending telemetry to Application Insights on or off — the official steps for connecting a Business Central environment or extension to Application Insights.
Troubleshooting: where to start
For troubleshooting specifically, Krzysztof pointed to two resources he relies on: Microsoft’s own sample repository and Stefano Demiliani’s blog, which regularly covers new telemetry signals and KQL query examples.
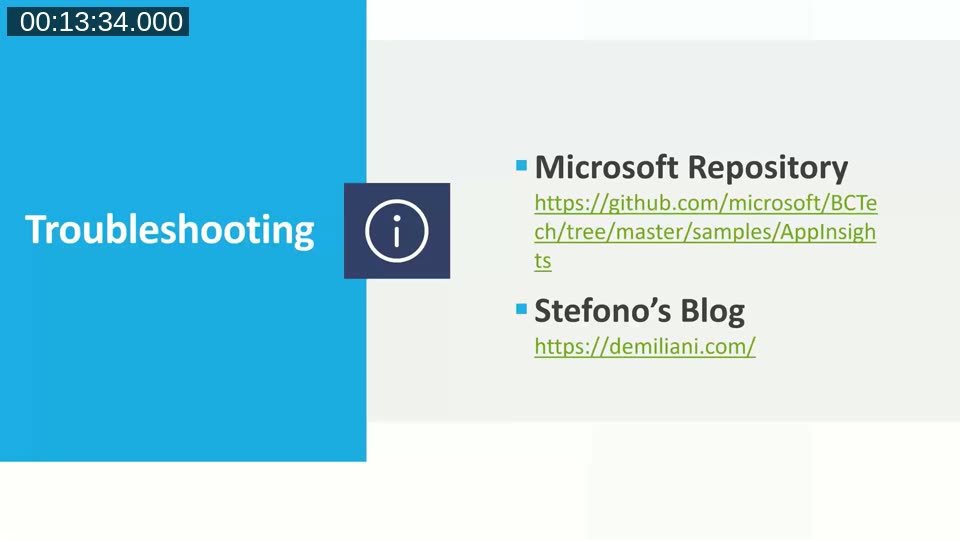
- Microsoft repository: github.com/microsoft/BCTech/tree/master/samples/AppInsights
- Stefano Demiliani’s blog: demiliani.com
Signals useful for troubleshooting differ for ISVs and VARs. ISV-relevant signals include AppSource submission validation results, Key Vault secret access, extension lifecycle events, long-running AL methods, long-running SQL operations, and report generation. VAR-relevant signals add company lifecycle, authorization and web service key checks, database lock timeouts, job queue status, permissions, task scheduler lifecycle, and email sending.
📖 Docs: BCTech AppInsights KQL samples — ready-to-use Kusto queries organized by signal type, including data collection rules and alerting examples.
The questions telemetry answers for ISVs
Krzysztof’s biggest takeaway: the hardest part of running an AppSource app isn’t getting it installed, it’s keeping customers engaged and showing them what to do next. Telemetry is how you get visibility into that, instead of being “blind” after the sale.
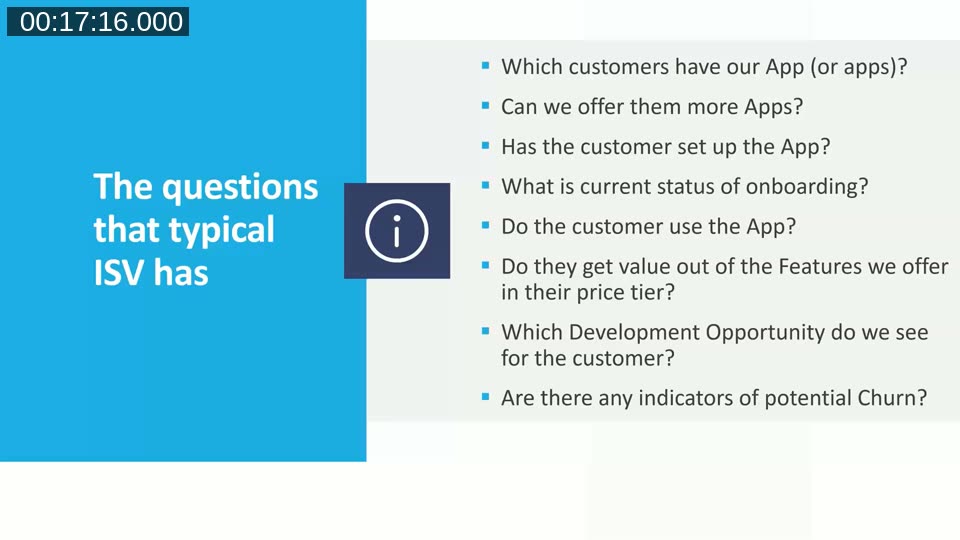
Typical questions an ISV can answer from telemetry:
- Which customers have the app (or apps)?
- Can you offer them additional apps?
- Has the customer set up the app, and what’s the onboarding status?
- Is the customer actively using the app?
- Are they getting value from the features included in their price tier?
- What development opportunities exist for this customer?
- Are there any indicators of potential churn?
VARs have a parallel set of questions: are customers using all areas of the system, were processes well designed and actually adopted, where are the upsell opportunities, and are there churn indicators for Business Central as a whole?
Limitations to plan around
Before diving into the demo, Krzysztof was clear about what standard Business Central telemetry does not give you.
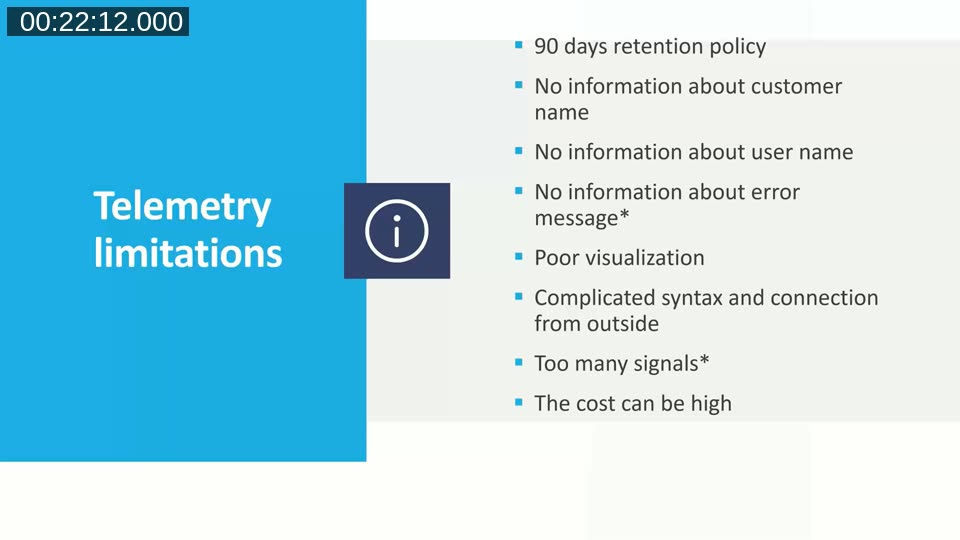
- 90-day retention — not enough if you want to track adoption over a year.
- No customer name — only a tenant ID for install/uninstall signals, so you need your own mapping table between tenant ID and customer name.
- No username — usernames are considered GDPR data and are never sent, for either ISVs or VARs.
- No error messages — for the same GDPR reasons, standard telemetry won’t show you the actual error text.
- Poor built-in visualization and a complicated query syntax that puts Application Insights out of reach for non-developers, unless you extract the data for them.
- No signal filtering — you currently get everything or nothing, which can drive up cost for high-volume extensions.
📖 Docs: Filtering telemetry signals with Azure Monitor Data Collection Rules — Stefano Demiliani’s follow-up post showing how to filter incoming signals before they land in Application Insights, addressing the “too many signals” limitation Krzysztof raised.
Working around the 90-day retention limit
To get around the retention and visualization limitations, Krzysztof’s approach is to pull data out of Application Insights on a daily or weekly schedule and store it somewhere with a longer shelf life.
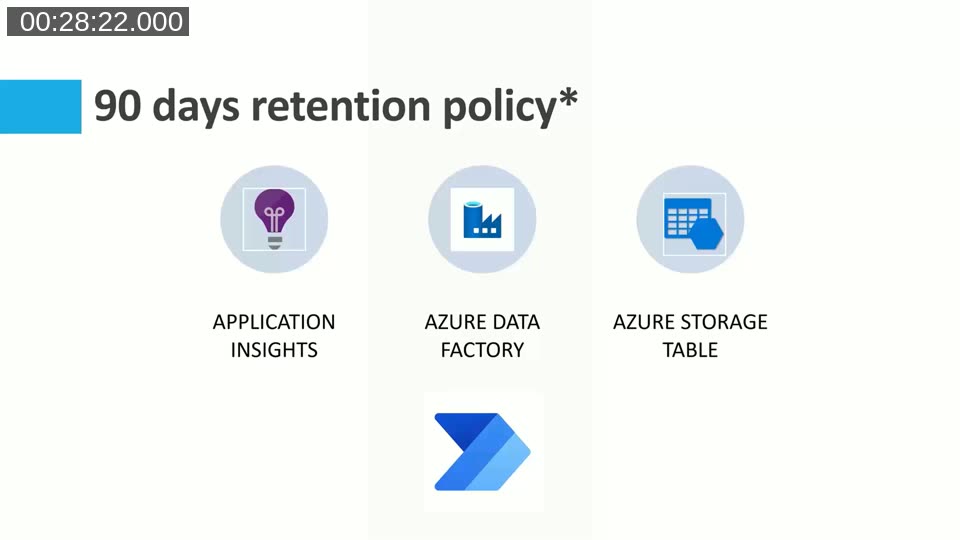
He tried Azure Data Factory first but ran into friction as a non-expert user of that tool. What works well for him day to day is simpler: a Power Automate flow queries Application Insights, filters out noise (like Docker container tenants), and writes the results into an Azure Storage table. From there, Power BI connects directly to the storage table — no manual export/import step required.
Demo: who has your apps?
With that pipeline in place, Krzysztof showed the flows and resulting dashboards. The first Power Automate flow tracks install, upgrade, and uninstall events, filters out irrelevant tenants, and maintains a lookup table mapping tenant IDs to customer names.
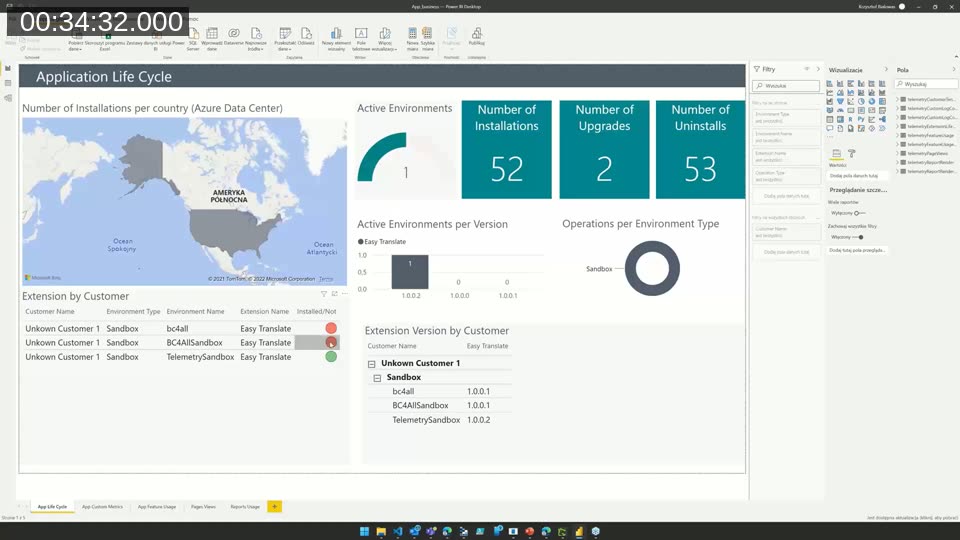
The resulting Power BI “Application Life Cycle” dashboard shows active environments, install/upgrade/uninstall counts, which app versions customers are running, and where apps are installed (production vs. sandbox) — including a map by Azure data center location. Because app versions don’t auto-upgrade between Business Central releases, this view lets a partner see who’s falling behind and follow up directly.
Custom telemetry and feature telemetry
Beyond what Business Central sends automatically, Krzysztof showed two ways to send your own signals from AL code. The first is custom metrics: subscribing to the OnSendDailyTelemetry event published by the standard “Telemetry Management” codeunit, and using EmitTelemetryOnRecordCount to report how many records exist in specific tables — for example, how many item translations a customer has created.
The second, newer option (available from Business Central 19.1) is the Feature Telemetry codeunit, which tracks whether a feature has been discovered, set up, or used, and can log related errors. Krzysztof demonstrated calling FeatureTelemetry.LogUptake with the Feature Uptake Status enum (Discovered, Set up) from a page’s OnOpenPage and setup logic.
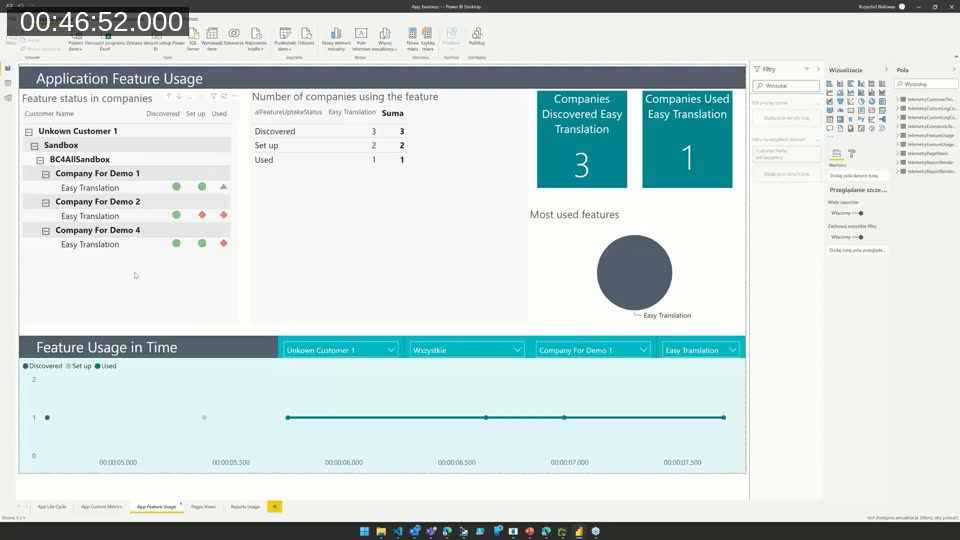
The resulting “Application Feature Usage” dashboard shows, per company, whether a feature was discovered, set up, or actually used — a funnel that highlights exactly where customers are getting stuck in onboarding, and which features are worth continuing to invest in.
📖 Docs: Feature telemetry — Microsoft’s reference for the Feature Telemetry codeunit, includingLogUptake,LogUsage, andLogError.
Demo: how users use the app
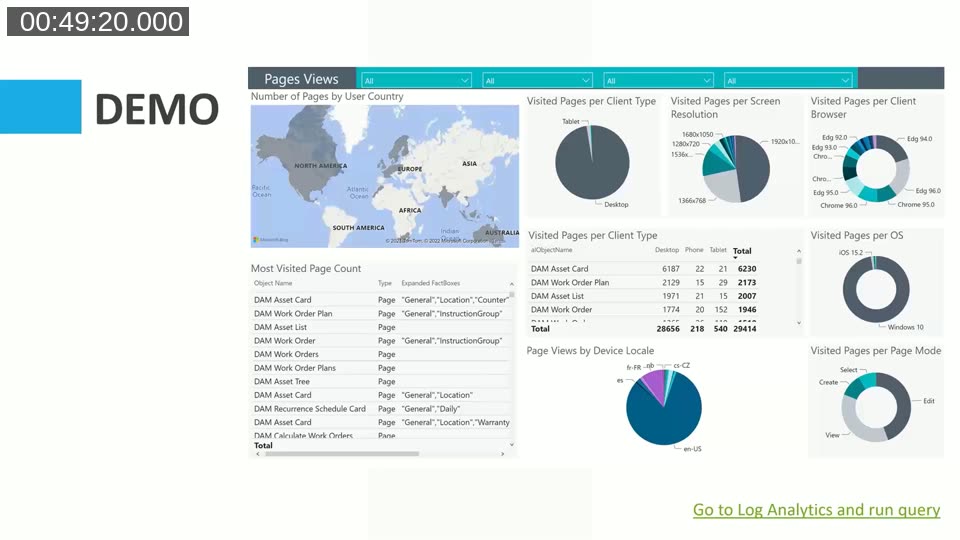
Standard page view and report telemetry answers questions about device type, browser, language, and which pages and reports are actually used. Krzysztof showed a dashboard built from a real customer’s app usage data: device type breakdown, browser and OS distribution, locale, and the most-visited pages — all useful input for deciding whether a translation, or a UI change, is worth the investment.
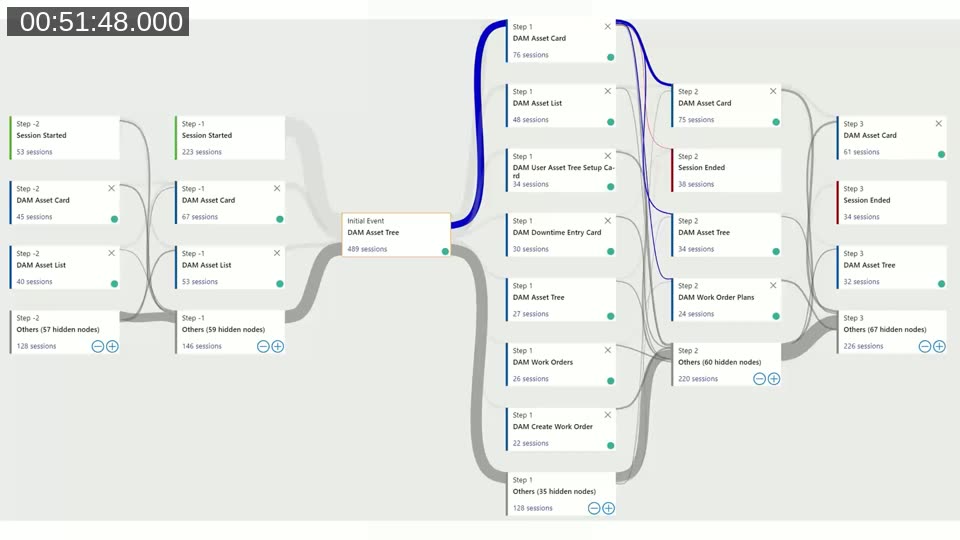
One of the more striking examples came from Application Insights’ built-in user flow visualization, which shows where users go after a given starting page. Krzysztof’s team used it to see what customers did after opening their app’s “Asset Tree” page, and separately discovered that a licensing page was causing users to drop off — a redesign of that single page led to a measurable increase in registrations through Business Central.
Reacting quicker: notifications
Rather than relying on Application Insights’ built-in alerting, Krzysztof again prefers Power Automate for notifications, because it can trigger email, Microsoft Teams messages, or automatic Azure DevOps tasks. He runs a daily flow summarizing new installs and upgrades, and a more frequent flow (every 15 minutes) for failed installations, so his team can react the same day rather than waiting for a customer to report the issue. VARs can apply the same pattern to job queue failures. Because usernames and error messages aren’t available in standard telemetry, the failure notification email shows the company, object, and status, but intentionally omits the error text — Krzysztof noted he’d cover a workaround for retrieving the actual error separately on his blog.
Try it yourself
To close the session — on his birthday — Krzysztof offered attendees the complete set of Power Automate flows and setup instructions used in the demos, distributed via a sign-up form during the live webinar. He noted that a Power Automate premium plan is required, and that one partner who set the flows up independently had it running within about two hours.
This post was drafted with AI assistance based on the webinar transcript and video content.