
In this session from January 2025, Stefan Maron and Arthur van de Vondervoort make the case for adding custom code analyzers to your AL development workflow. Moderated by Luc van Vugt, the webinar covers the motivation behind static code analysis, a live demonstration of the open-source BusinessCentral.LinterCop, how to build your own analyzer from a GitHub template, and how to wire everything into a DevOps pipeline.

Why Add a Custom Code Analyzer?
The short answer, as Stefan puts it, is simple: you want to catch as many bugs as possible. Every additional analyzer you enable gives you more diagnostics to react on, directly in the editor as you type.
Most teams already have a solid foundation — developer training, test-driven development, source control, branching strategies, code reviews, and CI/CD pipelines. But even with all of that in place, a custom analyzer can fill a gap that none of those practices cover: catching issues at the exact moment the code is written, before it ever leaves a developer’s machine.
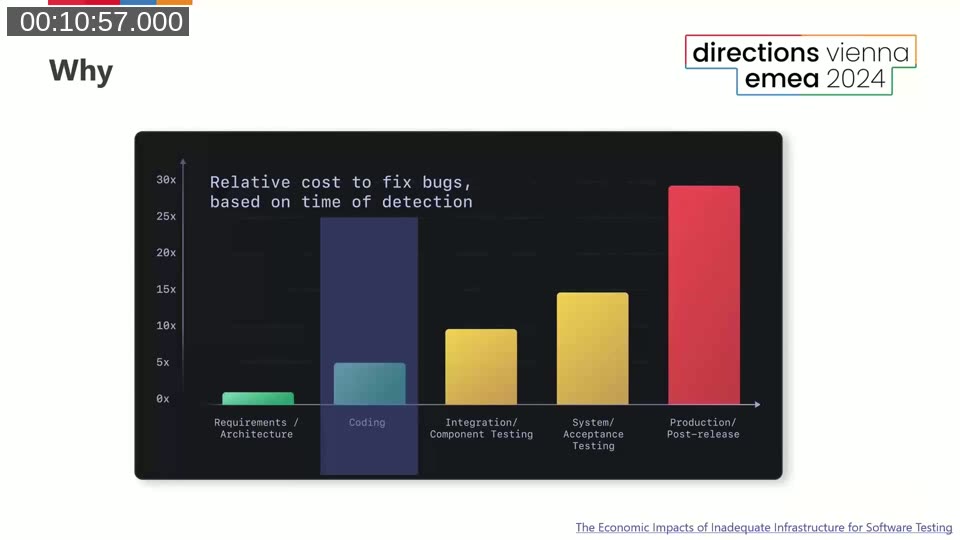
Stefan references research on the relative cost of fixing bugs at different stages of development. Catching a defect during coding is dramatically cheaper than finding it in system acceptance testing or, worse, in production. A bug caught in a requirements document is little more than a paragraph rewrite; the same bug discovered post-release can mean data corrections, customer impact analysis, and hotfix deployments. Code analyzers target the coding phase directly.
📖 Docs: The code analysis tool — Microsoft Learn — Overview of how to enable and use static code analysis in VS Code for AL projects, including the four built-in analyzers: CodeCop, UICop, PerTenantExtensionCop, and AppSourceCop.
Static vs. Dynamic Code Analysis
Arthur walks through the distinction between the two major approaches to code analysis in Business Central development.
Dynamic analysis runs code in a live environment — a Docker container, a sandbox, or through test suites and page scripting. It validates that code behaves as expected at runtime, but it requires a running Business Central instance and it can be difficult to achieve 100% code coverage.
Static analysis works entirely within VS Code, without executing any code. It reads and interprets the syntax and semantics of your AL files and reports issues with exact file, line, and column references. You get feedback as you type, with no test suite to maintain and no runtime environment required.
The two approaches are complementary. Static analysis cannot cover everything — runtime operations like reading and writing database records, working with RecordRef, or handling Variants require a live environment. But for a large class of common mistakes, static analysis is faster and more thorough.
LinterCop in Practice: A Demo Walkthrough
Arthur demonstrates the LinterCop on a small sample AL extension that compiles cleanly out of the box — zero errors, ready to ship to an acceptance environment. As soon as LinterCop is enabled via the VS Code status bar, 45 additional problems appear.
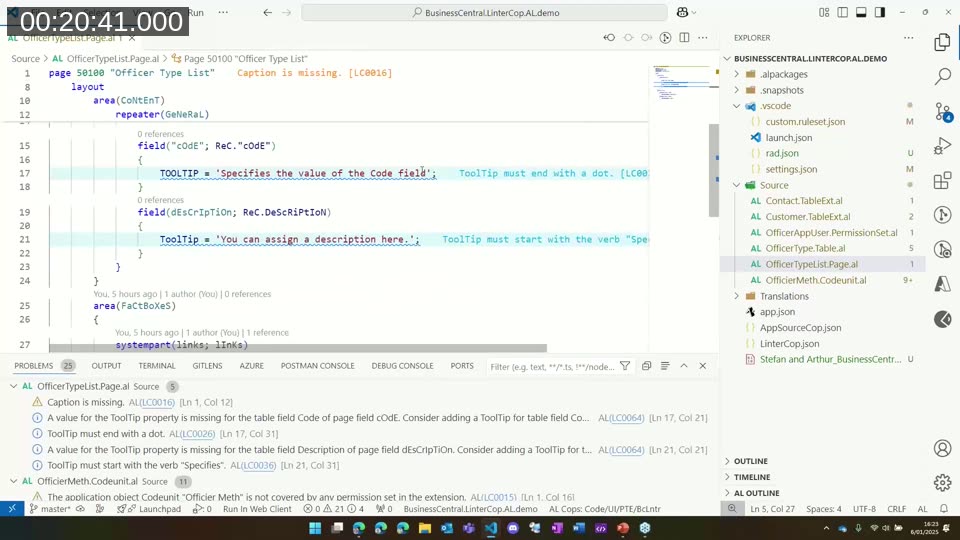
A selection of what the analyzer surfaces:
- Casing violations — field and variable names not following the expected PascalCase convention. These can be suppressed for an entire project by setting the rule severity to
nonein a custom ruleset file. - Missing Caption and ToolTip properties — LinterCop flags fields that lack captions and tooltips, and it validates tooltip content against Microsoft’s UX guidelines (e.g., tooltips should start with the word “Specifies”).
- Field ID conflicts across table extensions — if two table extensions in the same app use the same field number on different tables, AL’s
TransferFieldswill try to copy incompatible data types at runtime. LinterCop catches this at development time.
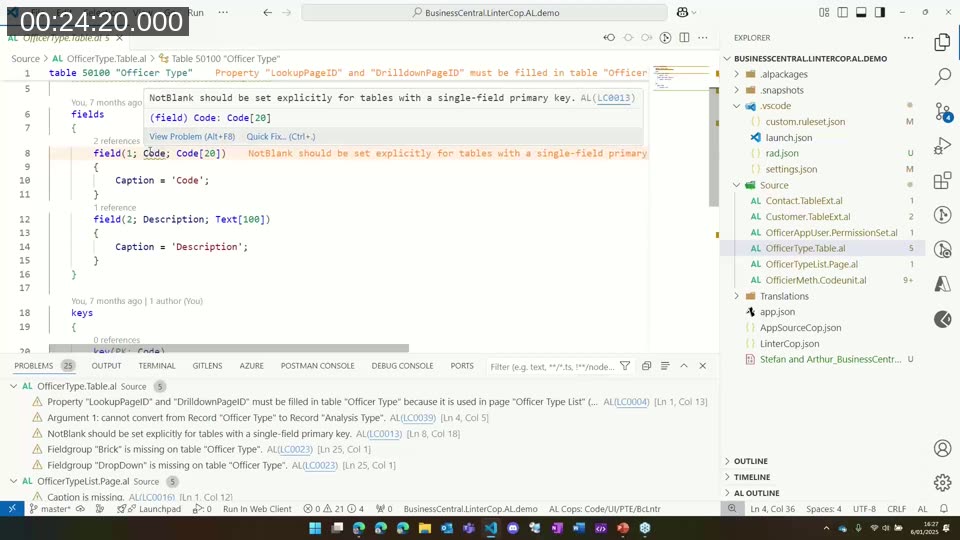
- NotBlank not set explicitly — on tables with a single-field primary key (like a Code field), LinterCop warns if the
NotBlankproperty is not explicitly declared. Leaving it implicit can lead to blank primary key records that cause cascading data issues later. - LookupPageId and DrillDownPageId missing — best practice is to set both; LinterCop flags when either is absent or points to the wrong page.
- LOCKTABLE deprecated — LinterCop recommends using the
ReadIsolationproperty instead. - Modify without RunTrigger set explicitly — the default is
false, but leaving it implicit makes code harder to read and maintain. LinterCop requires an explicit value. - Comments requiring justification — if a
COMMITis present, LinterCop flags it and asks for an inline comment explaining why, helping code reviewers immediately understand the intent.
📖 Docs: Using the code analysis tools with the ruleset — Microsoft Learn — How to create a .ruleset.json file to customize rule severity (Error, Warning, Info, Hidden, None) for individual diagnostic IDs across your project.
How LinterCop Started
Stefan traces the origin of the project to a build pipeline log. While reviewing the output of the AL compiler (alc.exe), he noticed a /analyzer parameter that listed the DLL paths of the built-in analyzers. The parameter appeared to accept a list — which raised an obvious question: could you add your own?
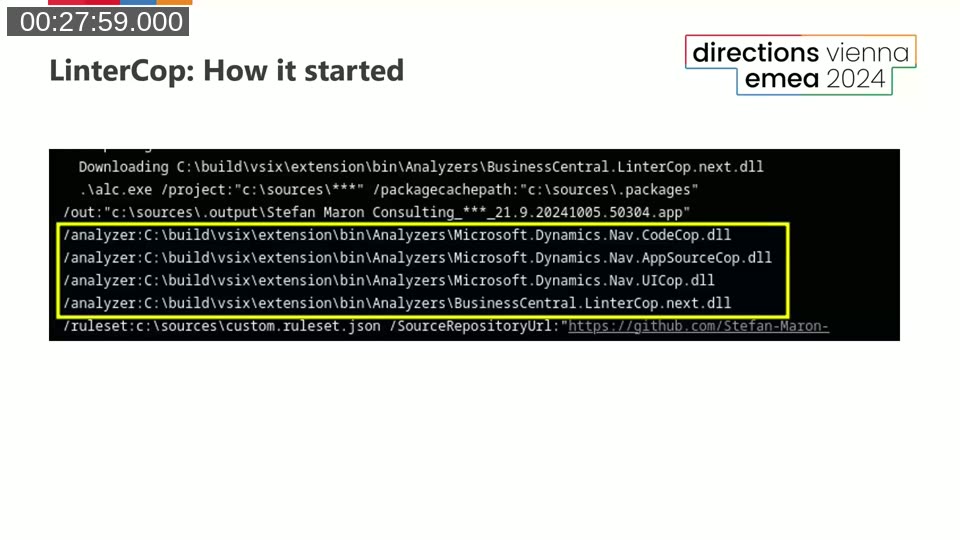
After decompiling the compiler and investigating the underlying C# interfaces, Stefan found that the extension point was not private — it was intentionally open. He built a first proof-of-concept in September 2021: a rule that flags flow fields with the Editable property set to true. That rule originally took dozens of lines; today, the same check is four lines of C#.
The project grew from there. By early 2025 the LinterCop had reached 1.6 million downloads, 30,000 downloads of the latest version alone, 74 published rules, and 86 rules including those in pre-release. Automated tests for rules, a working debugger setup, and full CI/CD pipelines were all community contributions — Arthur being a major contributor on the DevOps and test automation side.
Rule Examples: Catching Real Bugs
Arthur walks through further rule examples from the LinterCop rule catalogue:
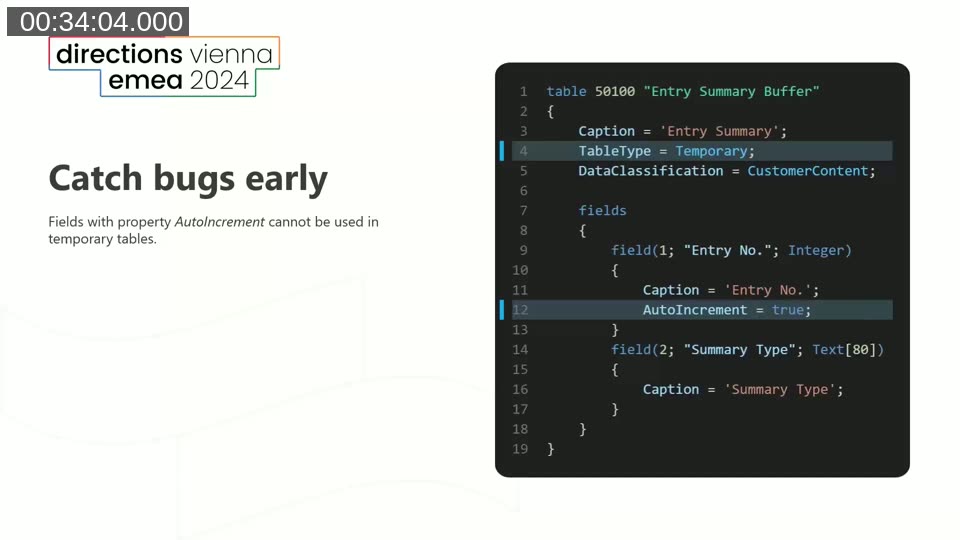
AutoIncrement on temporary tables — the database cannot auto-increment a field on a temporary table because there is no synchronized schema. LinterCop flags this immediately, preventing a runtime error that would only surface when the record is inserted.
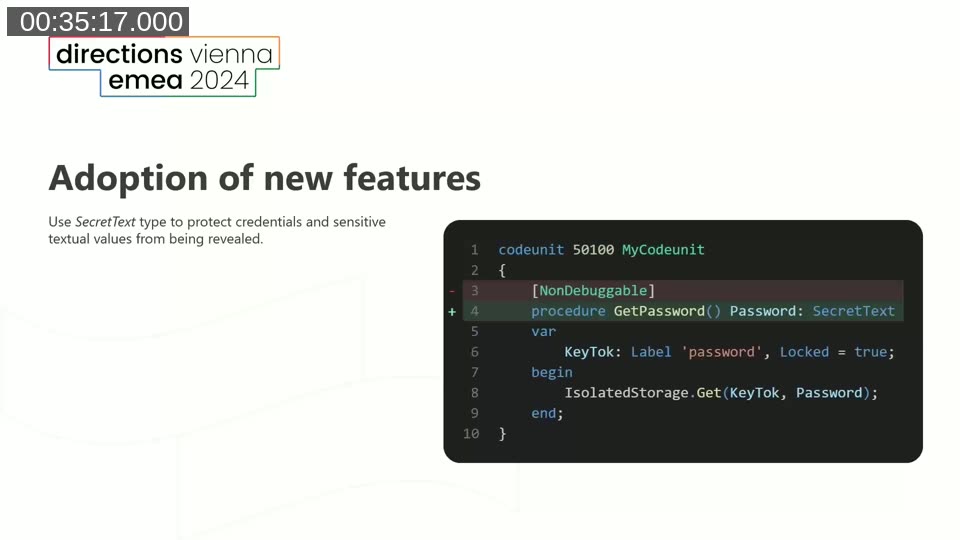
SecretText adoption — LinterCop flags procedures that handle passwords or tokens using a plain Text variable decorated with [NonDebuggable]. The preferred approach is to use the SecretText type, which is sealed during debugging and does not expose the value, while also allowing the [NonDebuggable] attribute to be removed so the surrounding code remains debuggable.
Extensibility and accessibility properties — LinterCop prompts developers to explicitly declare Extensible and Access properties on objects. Setting them to Internal or false allows breaking changes without breaking downstream extensions, enabling faster iteration during initial development.
API page standards — for API pages, LinterCop enforces a set of mandatory fields (SystemId, LastModifiedDateTime) and naming conventions (e.g., use displayName instead of name; use number instead of no) that make APIs more predictable for external consumers and Power Automate integrations.
Building Your Own Analyzer
Stefan demonstrates how to create a custom analyzer from scratch using his GitHub template repository.
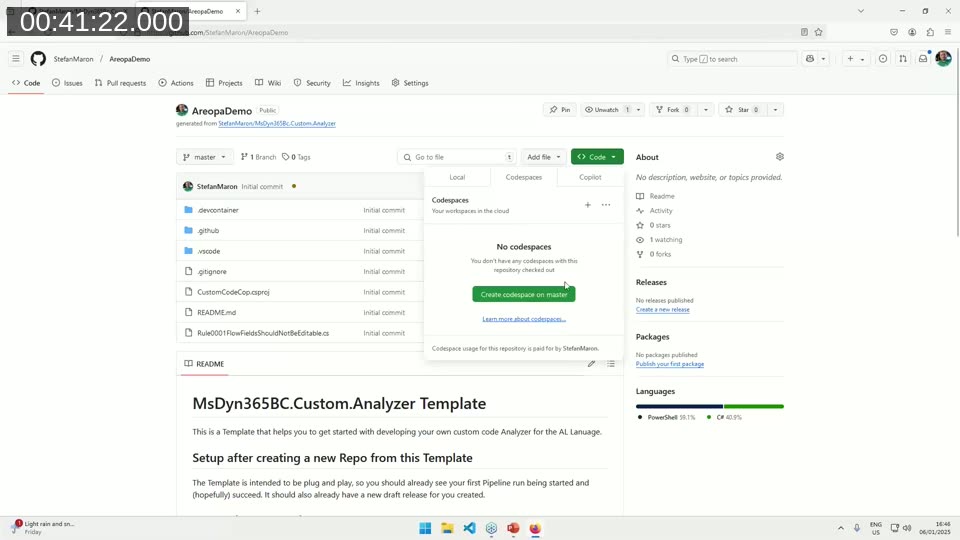
The template at github.com/StefanMaron/MsDyn365BC.Custom.Analyzer is plug-and-play: create a new repository from the template, and a GitHub Actions pipeline runs immediately, compiles the analyzer DLL for multiple AL language versions, and publishes a draft release. No local .NET toolchain setup is required.
For development, Stefan recommends using GitHub Codespaces. Opening a Codespace from the repository launches a pre-configured Linux environment with VS Code in the browser. Running the Prep Codespace task downloads the AL Language extension, sets up an AL project for testing, and wires up the custom analyzer DLL as a local reference. From there, you can write rules, build, and debug — all in the browser.
Debugging a custom analyzer works by attaching to the Dynamics Language Server process. Setting a breakpoint in the rule code and then editing any AL file re-triggers code analysis, hitting the breakpoint and exposing the full syntax tree in the debugger’s variables panel.
The rule structure is straightforward: each diagnostic analyzer class declares which AL syntax node types it registers for, then implements an analysis method that receives a context object for that node. The context exposes the full AL syntax and semantic model. Stefan shows the FlowFieldShouldNotBeEditable rule — the condition check is a single line, the diagnostic report another. The boilerplate around it is identical for every rule.
📖 Docs: Ruleset for the code analysis tool — Microsoft Learn — Complete schema reference for.ruleset.jsonfiles, includingincludedRuleSetsfor pointing to a shared company-wide ruleset via a URL.
DevOps Integration
Arthur covers how to bring custom analyzers into a DevOps workflow. All major AL build solutions — AL-Go for GitHub, Azure DevOps pipelines using BcContainerHelper, and similar tools — support custom code analyzers, and most have built-in LinterCop support.
The recommended pattern is to treat analyzer rules as a gate: any warning produced by the analyzers fails the build before tests even start. The team should have zero warnings in the solution before a pull request can be approved. This means code reviewers can focus on architecture and design rather than catching style and safety issues that the analyzer already handles automatically.
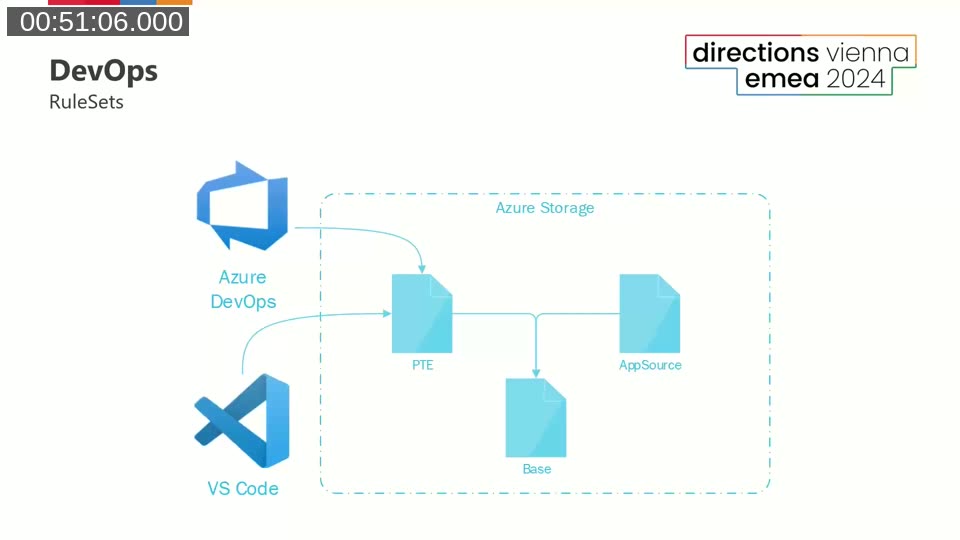
A key practical consideration is ruleset consistency between VS Code and the pipeline. If a developer’s local VS Code uses a different ruleset than the CI pipeline, warnings appear in the pipeline that were invisible locally — a frustrating experience. Arthur’s team solves this by hosting a shared ruleset on Azure Storage and pointing both VS Code (via al.ruleSetPath) and the build pipeline to the same URL. The includedRuleSets feature in the ruleset format makes it possible to compose a base ruleset with project-specific overrides.
Beyond Warnings: Extracting Statistical Information
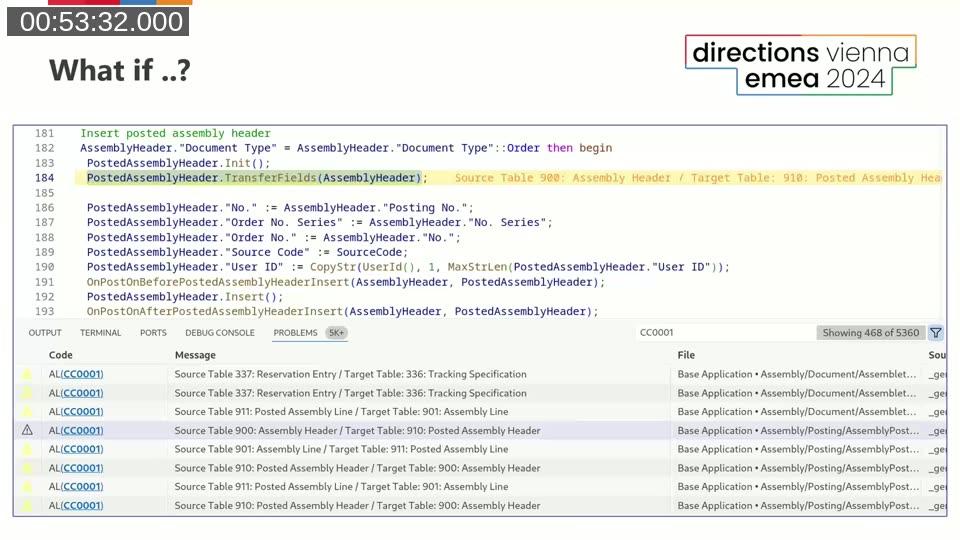
Stefan closes with an unconventional use of the analyzer engine. Instead of emitting warnings about problems, an analyzer rule can be used to extract information from AL code. As a demonstration, Stefan wrote a rule that finds every TransferFields call in the Base Application and emits a diagnostic containing the source and target table IDs.
Running this against the Base Application produces over 420 unique table combinations — far more than most developers would expect. The technique is essentially a structured code search, with the full power of the AL semantic model available rather than relying on text pattern matching. Possible applications include generating reference data for other rules, auditing API surface, or mapping inter-table data flows.
Getting Started
Both presenters offer the same practical advice for teams considering custom analyzers:
- Start with the LinterCop. Install the BusinessCentral.LinterCop VS Code extension, review the rules, and configure a ruleset that fits your team’s standards. You do not need to write any rules to benefit from the project.
- Pick easy rules first. Naming conventions, special characters in field names, required properties — these are simple to enforce and have a clear, unambiguous definition.
- Use the template. The MsDyn365BC.Custom.Analyzer template handles all the scaffolding so you can focus on writing rules rather than setting up the project.
- Contribute ideas. Even if you are not writing C#, the LinterCop discussion board on GitHub welcomes feature requests and rule proposals from anyone in the AL community.
📖 Docs: Use GitHub Codespaces for AL development — Microsoft Learn — How to configure Codespaces for AL projects, including enabling code analyzers via devcontainer.json, which mirrors the approach used in the custom analyzer template.
This post was drafted with AI assistance based on the webinar transcript and video content.