
In this Areopa Academy webinar — episode 108 of the series — Jeremy Vyska walks through Mermaid, a Markdown-powered diagramming language that turns plain text into rendered diagrams. Originally presented at Days of Knowledge Nordic 2025, this session covers how Business Central developers and consultants can use Mermaid to validate ideas, document processes, onboard developers, generate documentation with AI, and even visualise code performance. Tine Starič moderates and handles the Q&A.
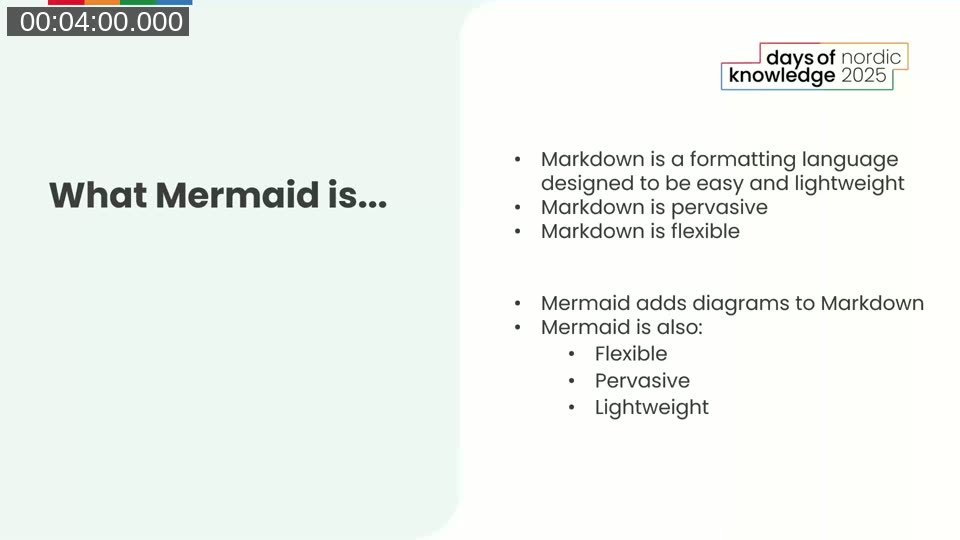
What Is Mermaid?
Markdown is a lightweight formatting language used widely across Azure DevOps, GitHub, and other platforms. Mermaid extends Markdown by adding diagram support — using the same plain-text, code-driven approach. Because Mermaid is just text, it works everywhere Markdown works, can be version-controlled, and requires no specialised tooling to edit.
Jeremy is clear about what Mermaid is and is not: it is excellent for quick, code-managed diagrams that evolve alongside a project. It is not a graphic design tool, and it will not replace a drag-and-drop diagramming application when pixel-perfect layouts are needed.
📖 Docs: mermaid.js.org — Introduction — the official getting-started page covers installation, supported diagram types, and live editor access.
A First Example: The Sequence Diagram
Jeremy opens with a simple sequence diagram — a common scenario in Business Central projects. The Mermaid source defines three participants (Website, OrderClerk, LogisticsTeam) and five message steps. Mermaid renders this as a clear sequence diagram without any manual drawing.
sequenceDiagram
  participant Website
  participant OrderClerk
  participant LogisticsTeam

  Website->>OrderClerk: Submit Quote
  OrderClerk-->>OrderClerk: Convert Quote to Order
  OrderClerk-->>OrderClerk: Release Order
  OrderClerk->>LogisticsTeam: Create Shipment
  LogisticsTeam-->>LogisticsTeam: Post Shipment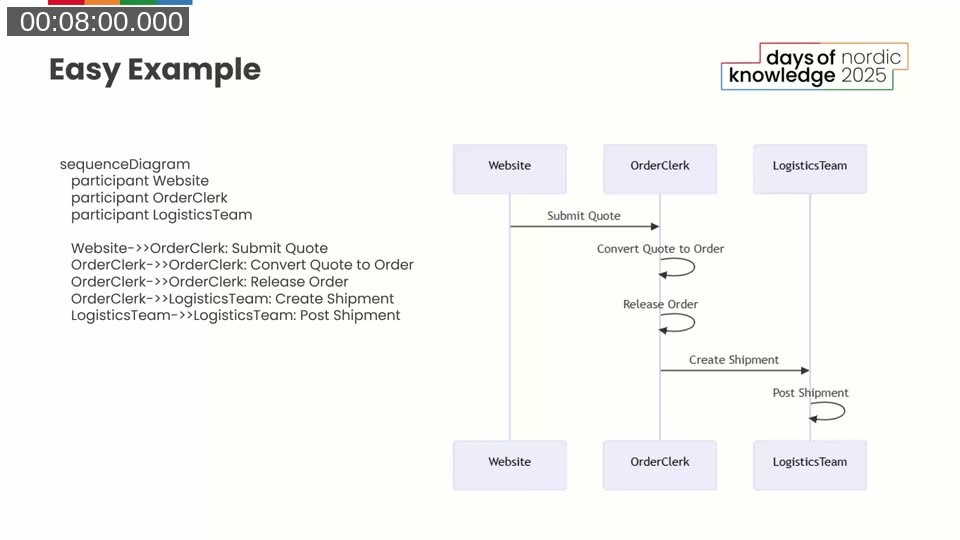
Diagram Types Available in Mermaid
Beyond sequence diagrams, Mermaid supports flowcharts, Gantt charts, class diagrams, entity-relationship diagrams, Git graph diagrams, user journey maps, quadrant charts, timelines, Kanban, mindmaps, and more. Jeremy demonstrates the mermaid.js.org documentation site, which shows live examples of each type with editable source.
The variety means there is usually a diagram type that fits the situation — whether mapping a data flow, illustrating a branching strategy for developers, or showing a dependency structure.
Validating Ideas: Data Flow Diagrams
One of Jeremy’s main use cases is using Mermaid during discovery conversations. When a client asks, for example, to add a contract number field to an invoice, a quick flowchart showing how data moves from Customer, Item, Pricing, and Discounts through to the Sales Order and Invoice makes the scope of change immediately clear.
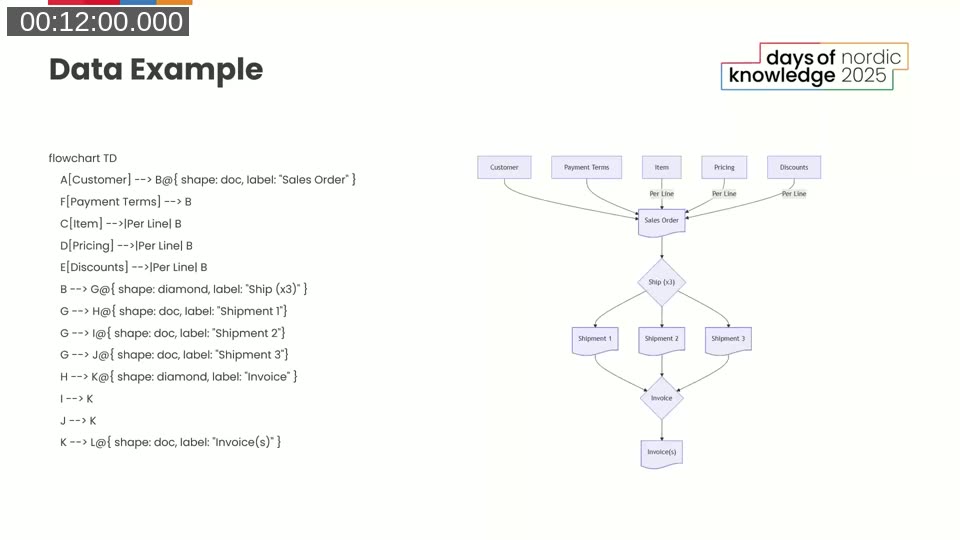
Rather than describing the change verbally or opening a whiteboard tool, Jeremy builds the diagram live during the meeting. The resulting plain text goes directly into an Azure DevOps work item as Mermaid, giving the team a version-controlled record of what the client reviewed and approved.
Discovering Scope Gaps: Process Flows with Alt/Else Branches
Mermaid’s sequence diagram supports alt/else blocks that model conditional branches. Jeremy shows a real example from a PTE project: a website submits a quote, the order clerk converts and releases it, and a manager either approves or disapproves. Drawing this out revealed a process gap — there was no way for the website to receive a disapproval notification. The order clerk would need to notify the customer directly.
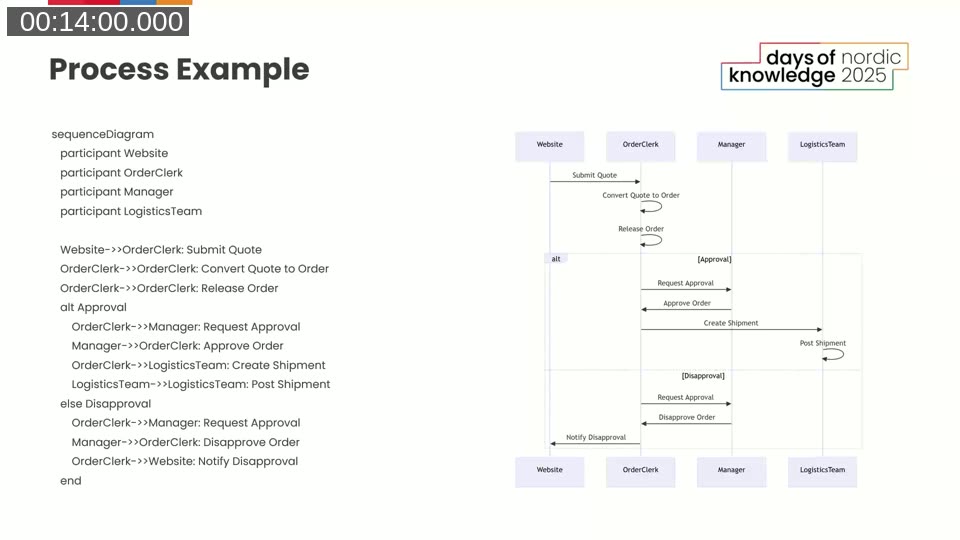
Catching that gap in a first discovery conversation, before any code was written, saved significant rework. As Jeremy puts it: “the only code with no bugs is no code at all.”
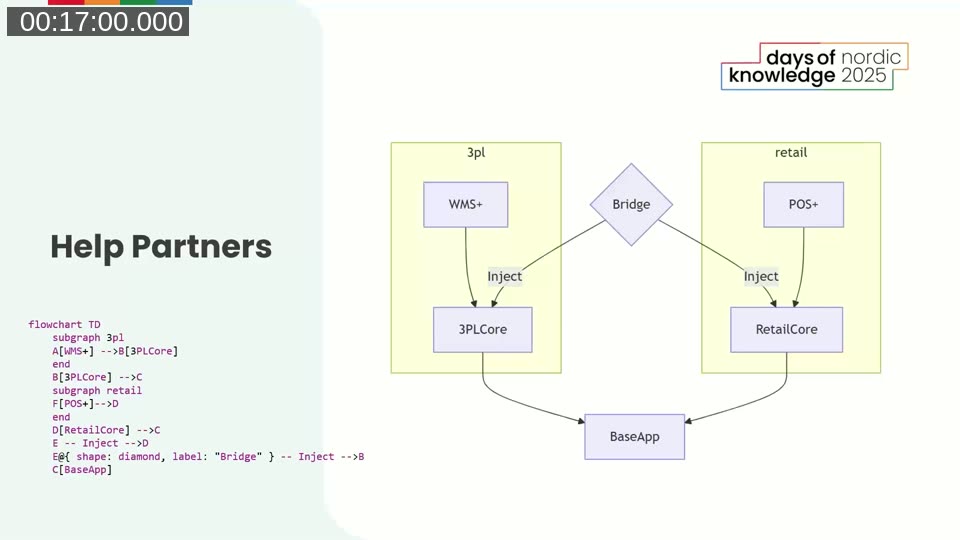
Helping Partners: Documenting App Architecture
When two AppSource apps need to interoperate without creating a direct dependency, a bridge app using dependency injection is the standard approach. Mermaid makes it straightforward to explain this architecture to partners and customers. The flowchart below — generated with a few lines of Mermaid text — shows how a WMS+ app and a POS+ app connect to a shared BaseApp through a Bridge, with each injecting into their respective core app.
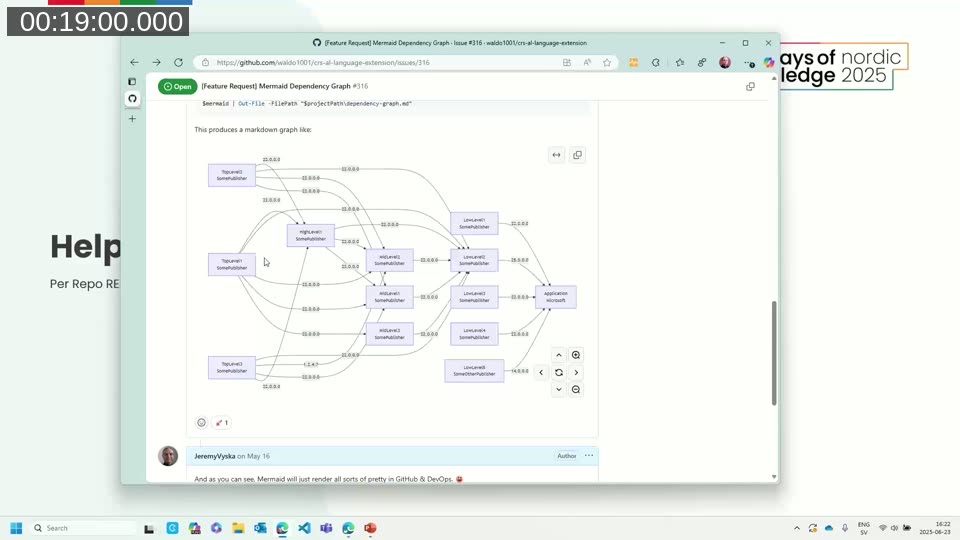
Onboarding Developers: Repo README Documentation
Jeremy strongly recommends including Mermaid diagrams in repository README files. Because Mermaid is plain text, it is checked in alongside code and rendered automatically in Azure DevOps and GitHub. A README can include a dependency tree, key process flows, and event triggers — everything a new developer needs to orient themselves without asking senior team members.
He shared a PowerShell script posted as a feature request on the CRS AL Language Extension repository (issue #316) that scans all app.json files in a workspace, extracts dependency information, and generates a Mermaid graph. The result is a ready-to-paste markdown dependency map with version labels on each arrow.
📖 Docs: Mermaid Flowchart Syntax — complete reference for flowchart nodes, edges, subgraphs, and styling options.
Generating Documentation with GitHub Copilot
Because Mermaid is plain text, AI coding assistants understand it natively. Jeremy demonstrates asking GitHub Copilot to analyse a complex Business Central codeunit — one that processes web queue orders, validates records, creates sales documents, and checks inventory — and produce a top-level flowchart plus individual sequence diagrams for each sub-step.
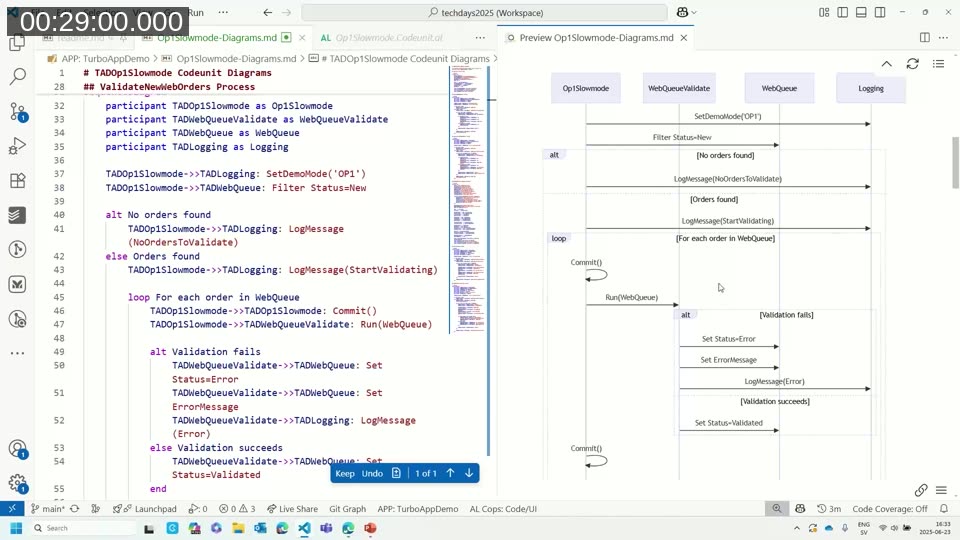
Copilot read through the codeunit and its ancillary code units, then produced a formatted Mermaid file ready to paste into a README. In one case it overrode Jeremy’s request for a sequence diagram, correctly inferring that a flowchart was more appropriate for a step with many yes/no branches. The resulting diagrams go into a Diagrams.md file, checked into the repo, and from that point forward Copilot can use those diagrams as context when assisting with changes.
This creates a virtuous cycle: diagrams generated from code become context for further AI-assisted development, and any future change to the diagram is tracked in source control.
📖 Docs: GitHub Copilot in VS Code — how to use Copilot in agent mode to read files across a workspace and generate output, including Mermaid diagrams.
Troubleshooting Logic: Rubber Duck Debugging with Mermaid
Jeremy describes another practical workflow: asking Copilot to represent a procedure in Mermaid as a sanity check on the logic. In a real example involving currency exchange rate gain/loss account overrides in Business Central, he asked Copilot to produce a clear flowchart of a procedure — with a key addition to the prompt: “don’t just use the code for the steps, re-summarise them.”
The resulting left-to-right flowchart showed the conditional logic at a glance: check if the bank account posting group is empty, exit if so; try to retrieve the posting group, exit if it fails; check whether the gain account is already set; set it and mark IsHandled = true if not. That diagram made it easy to review the logic with a colleague and confirm there were no unhandled paths.
Visualising Performance: Gantt Charts from AL Code
One of the more creative uses Jeremy demonstrates is generating Gantt charts to visualise operation timing inside Business Central. The idea originated at BC Tech Days, where he was demonstrating parallel job queue processing. Rather than relying solely on telemetry, he built a Business Central page that reads a log entry table and generates Mermaid Gantt syntax on the fly.
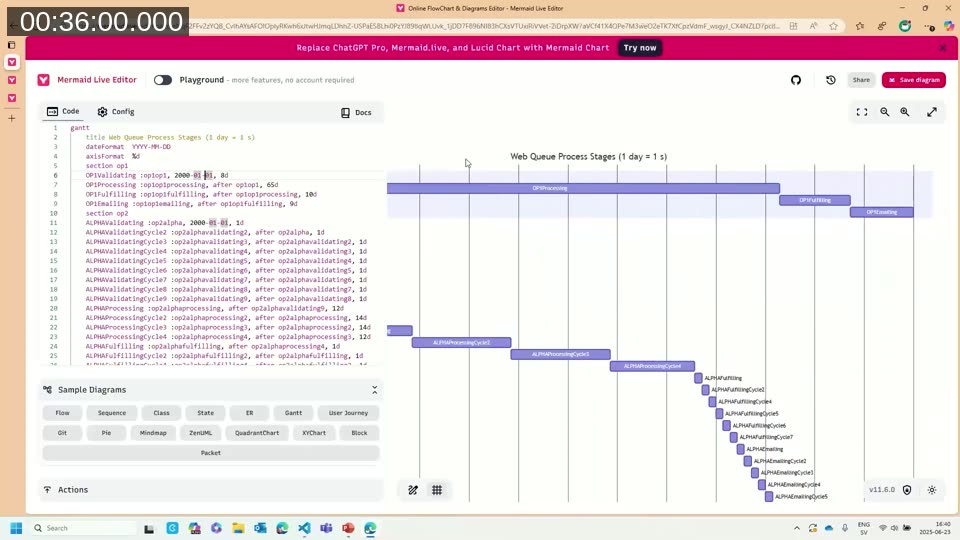
The AL code unit iterates through log entries, calculates how long each operation took, and writes lines of Mermaid Gantt markup into a text buffer. A “Generate Chart” button on the page outputs this markup, which can be pasted into mermaid.live to render the chart instantly.
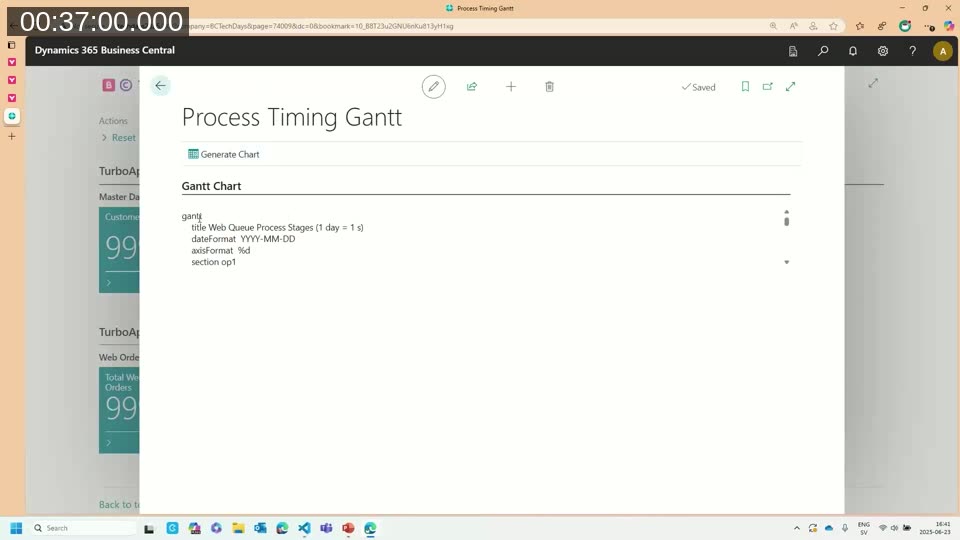
In the demo, validating runs fast while the processing stage is slow — exactly the kind of insight that helps target optimisation efforts. The code is available on GitHub and does not require the BC Tech Days session recording to use.
The Mermaid Live Editor
For anyone who prefers a visual starting point, mermaid.live provides a browser-based editor with VS Code-style keyboard shortcuts, autocomplete, sample diagrams for every type, and export to PNG or SVG. A playground mode allows some click-and-drag node adjustments, though it is better suited for minor tweaks than full diagram construction. MermaidChart.com extends this with team collaboration features.
Q&A Highlights
- Converting from draw.io: Jeremy suggested that GitHub Copilot might be able to help convert existing diagrams, since both formats are open standards. Mermaid’s playground mode can assist with minor layout adjustments, but draw.io offers more granular positioning control.
- Exporting to Visio: Mermaid supports PNG and SVG export natively; exporting directly to Visio format is not a built-in feature.
- WYSIWYG during meetings: Jeremy uses mermaid.live as a live scratchpad in Teams or Zoom calls — typing the diagram as the discussion unfolds and sharing his screen. This lets clients confirm the diagram reflects their intent in real time.
- Folder and namespace visualisation: AI coding assistants are already good at reading folder structures and re-describing them. PowerShell scripts can also generate Mermaid output from folder trees for quick visual review.
- Best practices for README integration: No formal community standard exists yet for Business Central projects. Jeremy’s internal practice is to document all core processes and extensibility points in Mermaid diagrams within the README — particularly dependency graphs for PTE ecosystems.
This post was drafted with AI assistance based on the webinar transcript and video content.