
In this webinar, Tonya Bricco-Meske — Microsoft MVP and BC developer at RSM — covers Excel Report Layouts in Business Central from the ground up. She walks through a four-step process for building layouts on existing report datasets, demonstrates real production examples, and shows how to take things further with refreshable reports that pull live data from BC APIs via Power Query. Bert Verbeek moderates a lively Q&A at the end.
Why Excel Report Layouts?
Excel Report Layouts use the built-in functionality of Business Central — no add-ons, no coding required to get started. Where traditional RDLC and Word reports hand users a static flat file, Excel layouts give the data to Excel, which means pivot tables, slicers, conditional formatting, charts, and all the post-processing features users already know. Reports are interactive rather than print-oriented, and they can serve multiple views at once — for example, an executive summary on one sheet and day-to-day operational data on another.
The goals of Excel Report Layouts: built-in BC functionality, no coding experience required, strong analytical capabilities, data-driven reporting experience.
Another advantage is end-user involvement. Layout creation and maintenance no longer needs to go through a developer. Functional consultants, power users, and business analysts can modify how data is displayed, add new sheets, and adjust groupings — as long as they do not touch the data contract (more on that below).
📖 Docs: Working with Excel Layouts – Microsoft Learn — Official reference covering how to create, import, and manage Excel layouts in Business Central.
Excel Reports in the Wild
Tonya shares three production examples from client projects. The first is a Physical Inventory Count sheet: by enabling the “Show Qty. Calculated” and “Show Item Tracking Numbers” options and sending the Physical Inventory List report to Excel, warehouse staff can filter on location or item number, see calculated quantities alongside physical counts, and work through the count digitally. One client extended this further by importing the completed sheet back into BC to update and post the journal.
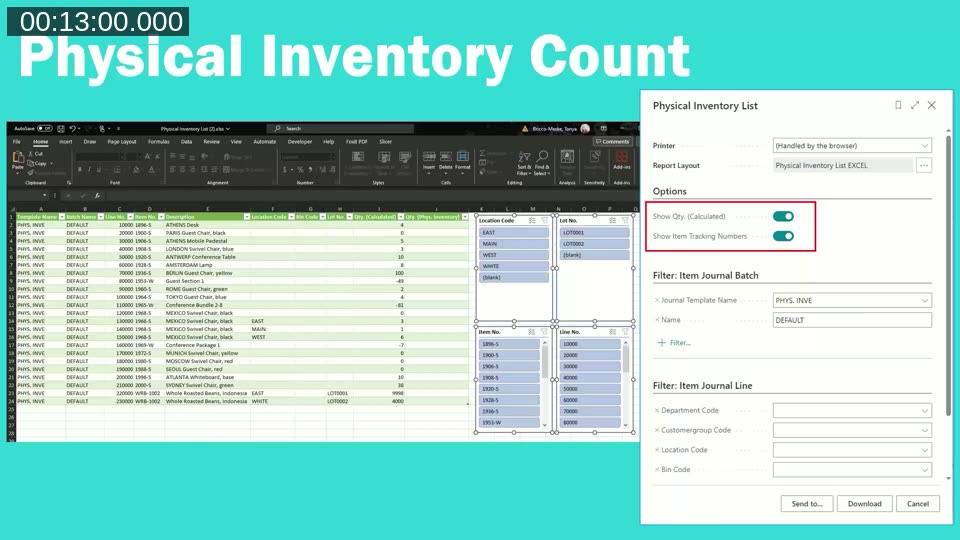
The Physical Inventory List report running with the Excel layout selected, showing the request page options alongside the resulting spreadsheet with slicers.
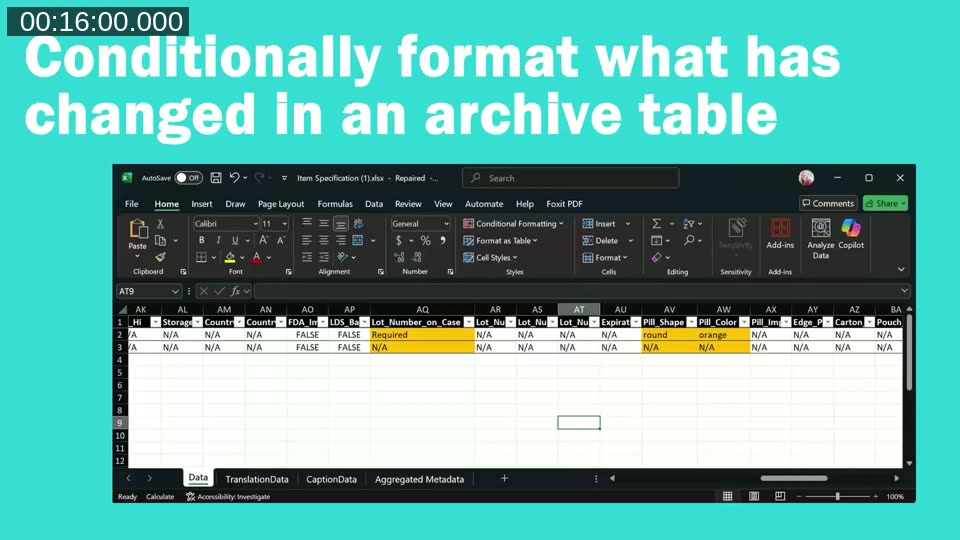
The second example is a certificate of origin for a boat manufacturer, printed on pre-printed stock where text must land in exact positions. The precision of Excel cell positioning gives more control than a Word layout for this use case. The third is a change-tracking report built on an archive table, using conditional formatting to highlight columns where values have changed — making it much easier to spot what’s different compared to browsing the change log.
The Four-Step Process
The four steps to create an Excel Report Layout: get the data contract, design the layout, import into BC, and test.
Step 1 — Get the Excel workbook with the data contract
In Business Central, search for any report, open its request page, and choose Send to > Microsoft Excel Document (Data Only). This produces an Excel workbook with a Data sheet. Row 1 of that sheet contains the column headers that map back to field names in the report dataset — this is the data contract. You should not rename these headers or reorder them, and the table must start at cell A1. The workbook also contains several hidden system sheets (Report Metadata, CaptionData, AggregatedMetadata, TranslationData).
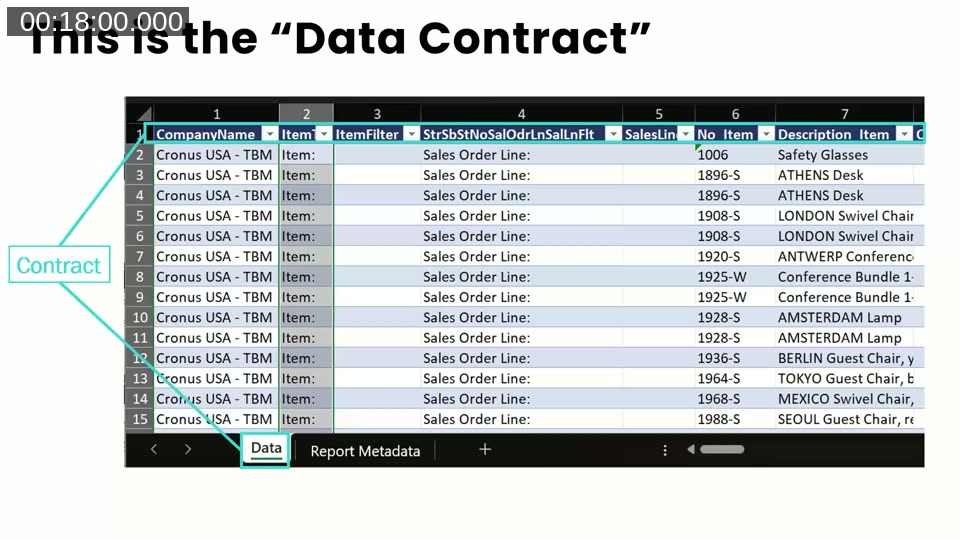
The Data sheet showing column headers in row 1 — these names are the data contract and must not be changed.
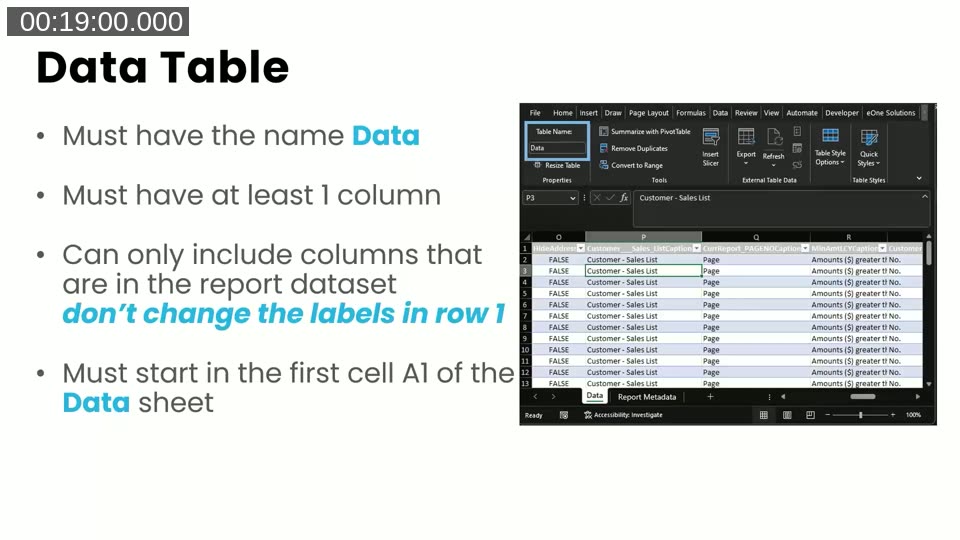
Data Table rules: must be named Data, at least one column, only columns from the report dataset, must start at A1.
The AggregatedMetadata sheet is worth paying attention to: it contains four tables covering report AL metadata, request metadata (tenant ID, environment name, company ID, UTC offset, layout used), request page filters, and report captions. This metadata becomes the foundation for refreshable reports. The CaptionData sheet provides caption keys you can reference with $captionKey$ tokens in your layout to support multi-language reports at runtime.
📖 Docs: Creating an Excel Layout Report – Microsoft Learn — Developer reference covering the data contract structure, system sheets, named formulas, and translation tags.
Step 2 — Design the layout using Excel features
With the data available, you build your presentation layer on a separate sheet (or multiple sheets). Microsoft provides pre-built named formulas in the Name Manager (accessible via Formulas tab) that wrap XLOOKUPs against the AggregatedMetadata table — so instead of writing a full lookup for the company ID or environment name, you can use the named reference directly. From here you can use any Excel capability: grouping and subtotals, conditional formatting, pivot tables, slicers, charts, or Copilot’s Analyze Data feature.
If OneDrive integration is configured in BC, reports open in Excel Online in a shared location rather than downloading to individual desktops, which enables real-time collaboration within the Microsoft 365 suite.
Step 3 — Import the layout file into Business Central
From the Report Layouts page in BC, click New Layout, give it a name and description, set the format to Excel, and upload the file. BC validates the upload: the file must not be password-protected, the Data worksheet must exist, and columns must match the data contract. Tonya’s practical tip: before uploading, manually delete the data rows from the Data sheet (leaving the header row intact) — this reduces what BC has to process during import and avoids edge cases where the upload stalls.
Step 4 — Test the layout
Select your layout on the Report Layouts page and click Run Report. BC generates the dataset, applies request page filters, loads the layout file, inserts data into the data contract, and delivers the merged workbook for download or Excel Online viewing.
The Report Layouts page in BC with the custom Excel layout selected alongside the standard RDLC layout for the same report.
Refreshable Excel Reports
Refreshable Excel Report Layouts go a step further: instead of BC pushing data into the workbook at run time, the workbook calls BC APIs directly via Power Query (OData). Opening the file and clicking Refresh All fetches the latest data on demand — no need to re-run the report from BC each time.
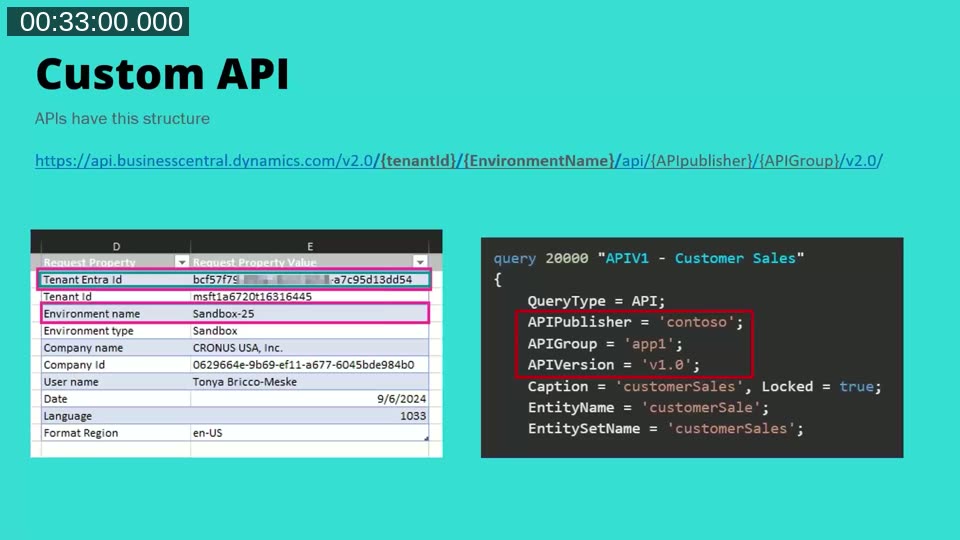
The API URL structure is: https://api.businesscentral.dynamics.com/v2.0/{tenantId}/{environmentName}/api/{publisher}/{group}/{version}/companies({companyId})/{entitySetName}. For standard BC APIs, the publisher, group, and version segments are not needed. The tenant ID, environment name, and company ID all live in the AggregatedMetadata sheet, so you can read them dynamically rather than hard-coding.
To set this up in Excel: go to Data > Get Data > From Other Sources > From OData Feed, paste in the API URL, and authenticate using Organizational account. Once connected, use the Power Query Advanced Editor to pull the environment variables from the metadata sheet and build the URL dynamically.
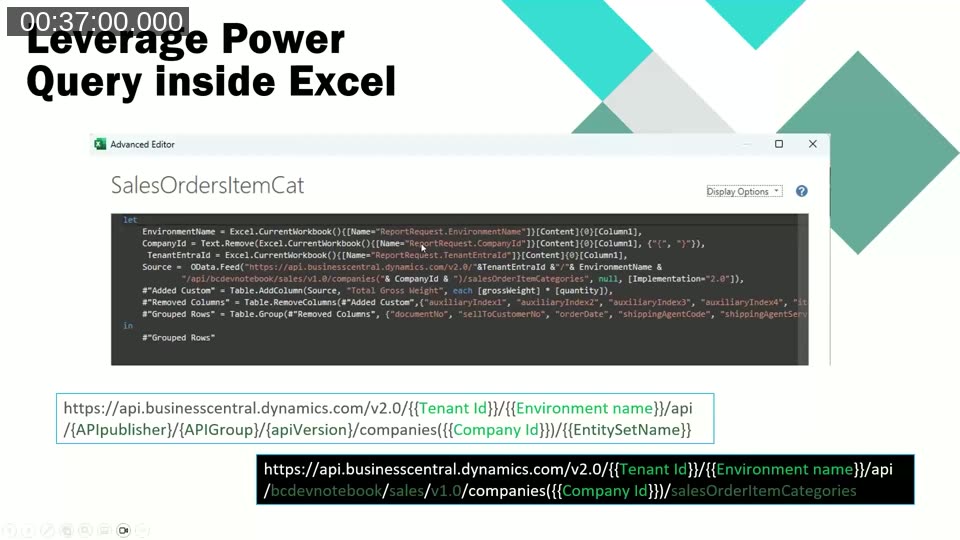
Power Query M code reading EnvironmentName, CompanyId, and TenantEntraId from the AggregatedMetadata sheet and constructing the API URL dynamically — no hardcoded tenant IDs.
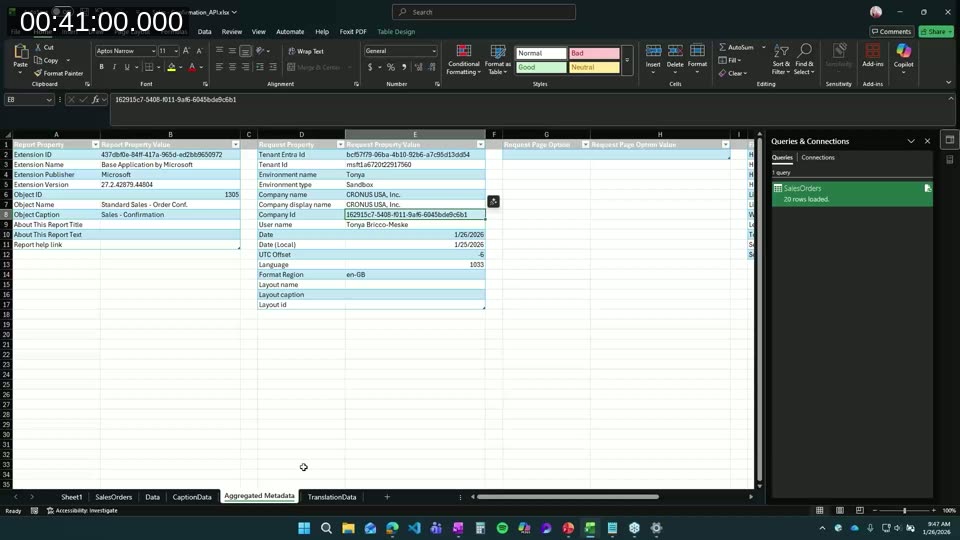
The Power Query Editor showing the SalesOrders query loaded from the BC OData API with 20 rows and the Applied Steps panel on the right.
During Q&A, Tonya addressed a few common questions. On permissions: a user connecting to BC via a refreshable report needs the same API permissions they would need to read those tables inside BC. On the hidden system sheets: they cannot be password-protected because BC must be able to write to the Data sheet during a standard report run. Refreshable-only reports stored externally (e.g. on OneDrive) can be password-protected since BC is not writing to them.
📖 Docs: OData Web Services – Microsoft Learn — Reference for querying BC data via OData, which underpins the Power Query connection used in refreshable Excel reports.
📖 Blog: Business Central Refreshable Excel Reports in BC25 – BC Dev Notebook — Tonya’s own deep-dive post covering the BC25 improvements to refreshable reports, including dynamic tenant IDs via the new TenantEntraId key.
Where to Start
Tonya’s suggested call to action: start small. Look at where users are already opening BC data in Excel and doing manual post-processing — grouping, summing, filtering. If that’s happening consistently, it can become an Excel Report Layout. Build on an existing report dataset first before creating a custom one, and add one new sheet or feature at a time. The full resources list from the session:
- bcdevnotebook.com/resources/#excel — Tonya’s curated list of Excel report posts
- aka.ms/bcExcel — Microsoft’s official Excel Report Layouts documentation hub
This post was drafted with AI assistance based on the webinar transcript and video content.